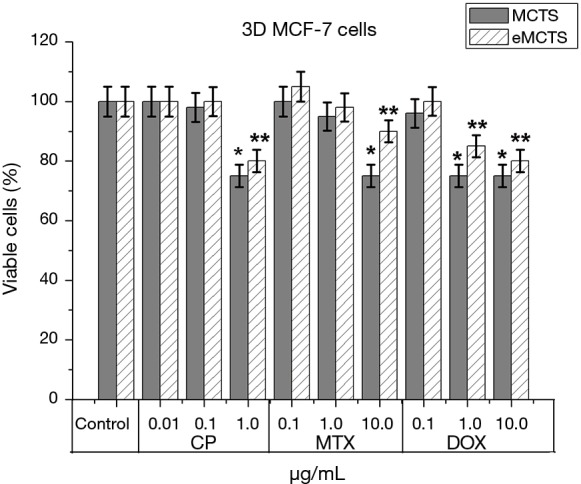
Figure 7.

Bar graphs showing comparison of the effect of anticancer drugs on cell viability in MCTS and eMCTS cell culture of MCF-7: cisplatin; methotrexate; doxorubicin; 48 hours of incubation, software Stemi2000 (Zeiss, Germany), 48 hours, *P≤0.05 for MCTS, compare with the control samples, **P≤0.05 for eMCTS, compare with the control samples. MCTS, multicellular tumor spheroids.
