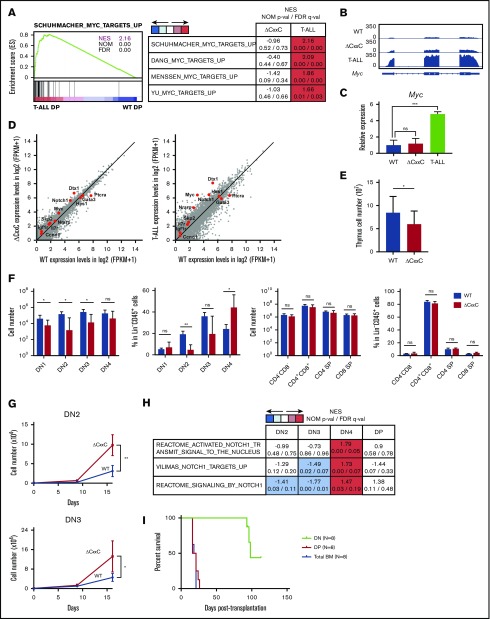
Figure 3.
KDM2B loss confers a growth advantage on DN thymocytes. (A) GSEA plot and GSEA summary of the MYC target gene sets demonstrating significant positive enrichment in ΔCxxC DP T-ALL cells relative to WT DP thymocytes (n = 2, each). Normalized enrichment scores (NES), nominal P values (NOM-p), and false discovery rates (FDR-q) are indicated. (B) A snapshot of RNA-seq signals at the Myc gene locus in WT and ΔCxxC DP thymocytes and ΔCxxC DP T-ALL cells. The structure of the Myc gene is indicated at the bottom. (C) Quantitative reverse transcription-PCR analysis of Myc in WT and ΔCxxC DP thymocytes and ΔCxxC DP T-ALL cells. Gapdh was used to normalize the amount of input RNA. Data are shown as the mean ± SEM (n = 3). (D) Scatter diagram showing RNA-seq data. Signal levels of RefSeq genes (FPKM+1 in log2) in WT and ΔCxxC DP thymocytes and ΔCxxC DP T-ALL cells are plotted. Representative direct target genes of NOTCH1 are shown as red dots. (E) Absolute cell numbers of thymus in WT and ΔCxxC mice (n = 4, each) 8 weeks after the injection of tamoxifen. (F) Absolute numbers and proportions of DN1 (CD25−CD44+), DN2 (CD25+CD44+), DN3 (CD25−CD44+), DN4 (CD25+CD44−), DN (CD4−CD8−), DP (CD4+CD8+), and CD4 or CD8 single positive (SP) cells among CD45.2 donor-derived cells in the thymus from WT and ΔCxxC mice (n = 4, each) 8 weeks after the injection of tamoxifen. Data are shown as means ± SD. (G) In vitro proliferation of WT and ΔCxxC thymocytes. DN2 or DN3 thymocytes from WT and ΔCxxC mice were cultured on TSt-4/DLL stromal cells in the presence of 10 ng/mL of SCF, Flt3L, and interleukin-7. Data are shown as the mean ± SEM of triplicate cultures. (H) GSEA summary of RNA-seq data of DN2, DN3, DN4, and DP cells in the thymus from WT and ΔCxxC mice. NES, NOM, and FDR are indicated. (I) Kaplan-Meier survival curves after serial transplantation assays. DN and DP T-ALL cells in thymus and total BM cells were collected from ΔCxxC T-ALL mice and were transplanted into sublethally irradiated recipient mice. Same numbers of the cells were transplanted (cohort 1: 2.5 × 10⁵/head, cohort 2: 4.0 × 10⁴/head). Data from 2 independent experiments were combined.

