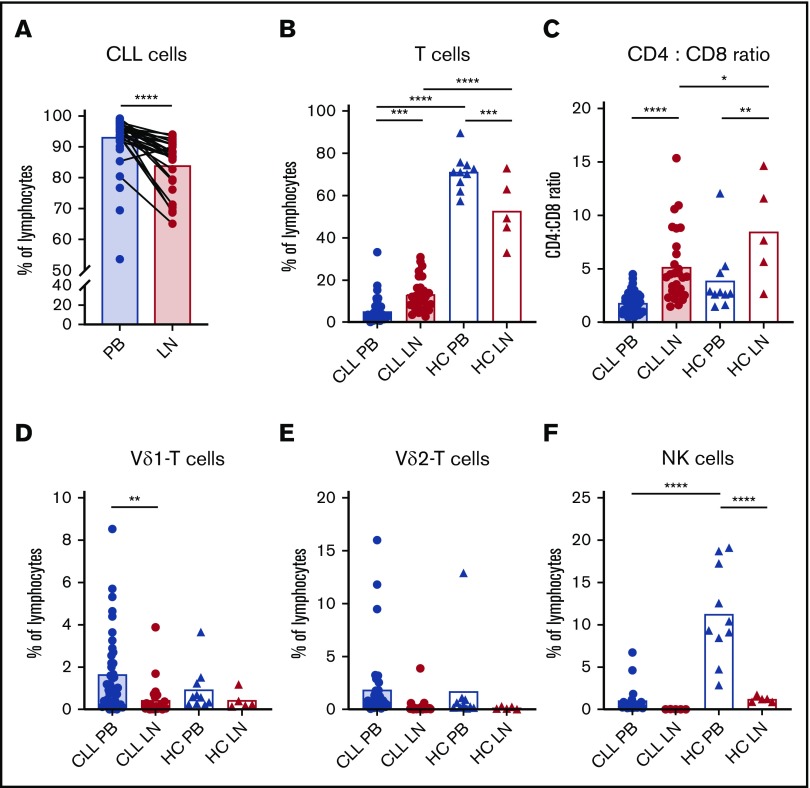
Figure 1.
Few cytotoxic lymphocytes in the LN of CLL patients. Lymphocyte analysis in PB and LN samples from untreated CLL patients (PB, n = 42; LN, n = 28) and HCs (PB, n = 10; LN, n = 5) by flow cytometry. Percentage of CLL (CD5+CD19+) cells (A) and T (CD3+) cells (B) within lymphocytes. (C) Ratio of CD4+/CD8+ T cells. Percentage of Vδ1+ cells (D) and Vδ2+ cells (E) within T cells. (F) Percentage of NK (CD56bright and CD16+) cells within lymphocytes (CLL PB, n = 21; CLL LN, n = 5). Data are presented as mean (bar) and individual patients (circles and triangles). *P < .05, **P < .01, ***P < .001, ****P <. 0001, Wilcoxon matched-pairs signed-rank test (A), 1-way ANOVA followed by Sidak’s multiple-comparisons test (B-F).

