Figure 3.
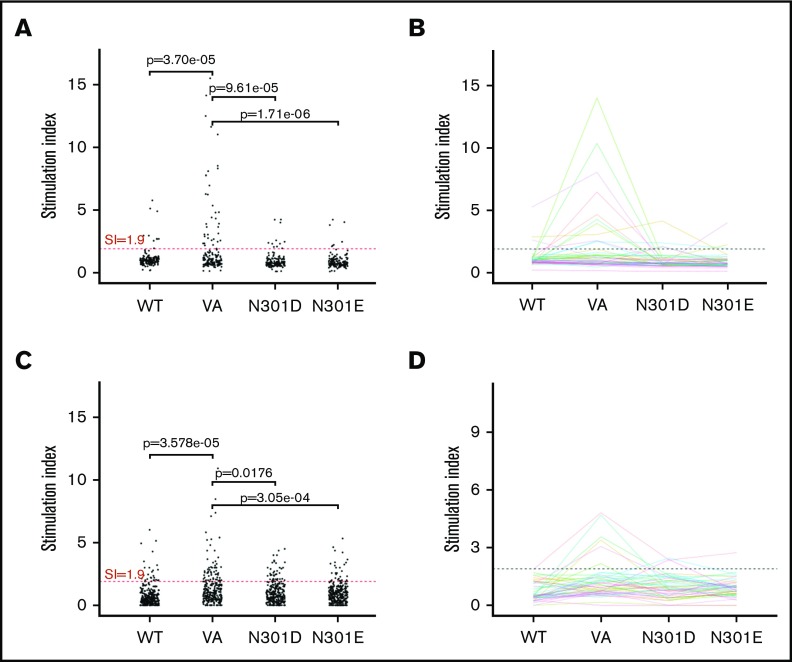
T-cell responses. T-cell proliferation assay. (A) Cells from 50 donors were subjected to a 3H-incorporation T-cell proliferation assay. PBMCs from each donor were stimulated with peptides derived from WT FVIIa, VA, and the mutants N301D and N301E. Day 8 SI values are shown. Comparisons between the groups were made using 1-sided Fisher's exact test on the hypotheses that there were (1) more responders to VA than WT and (2) fewer responders to either N301D or N301E than VA. The test compared the number of measurements that would be considered responders using a SI threshold of 1.9. Each dot represents a single measurement per donor. (B) The mean SI for each donor (3 replicates) was calculated. A mean SI > 1.9 (dotted line) is considered a positive responder. (C-D) IL-2 ELISpot assay. PBMCs from the same donors used in the T-cell proliferation assay were stimulated with the same peptides and IL-2 secreting cells were assessed by ELISpot assay. The analysis from panels A and B were repeated for the ELISpot assay.

