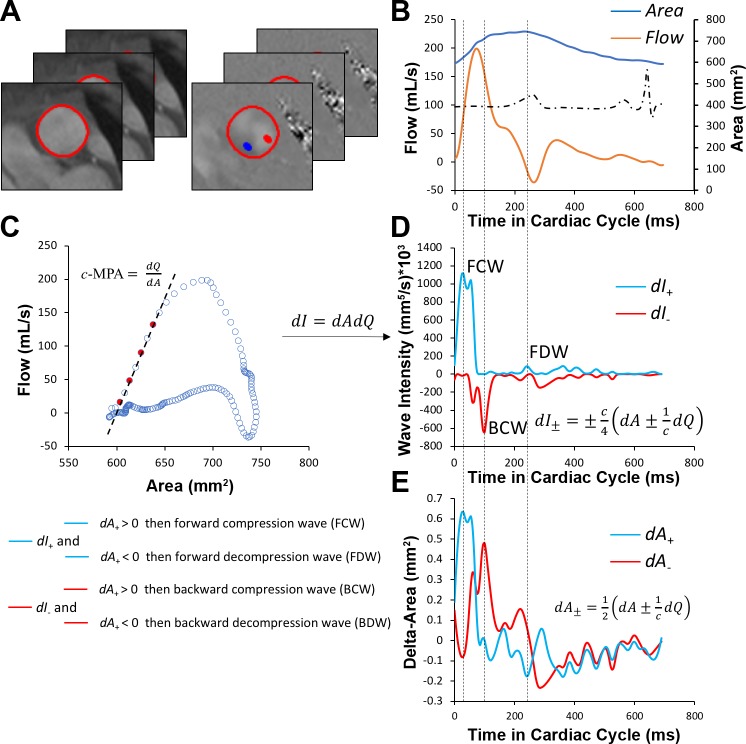
Fig. 1.
Wave intensity analysis workflow. A and B: segmented magnitude and phase images from acquired phase-contrast MRI (A) were required to create flow and area waveforms (B), which were further interpolated to achieve 5-ms temporal resolution. C: flow-area diagrams were reconstructed to calculate main pulmonary arterial wave speed (pulse wave velocity) by means of linear regression of noninterpolated data points (red) sampled during early systole. D: wave intensity spectra were then generated from separated flow and area waveforms. E: compression or decompression nature of the forward and backward waves was determined from separated area differential waveforms. c-MPA or c, wave speed/pulse wave velocity in the main pulmonary artery; dA+ and dA−, forward-positive and backward-negative components of area differential waveform, respectively; dI+ and dI−, forward-positive and backward-negative components of intensity differential waveform, respectively; dQ, flow differential waveform.

