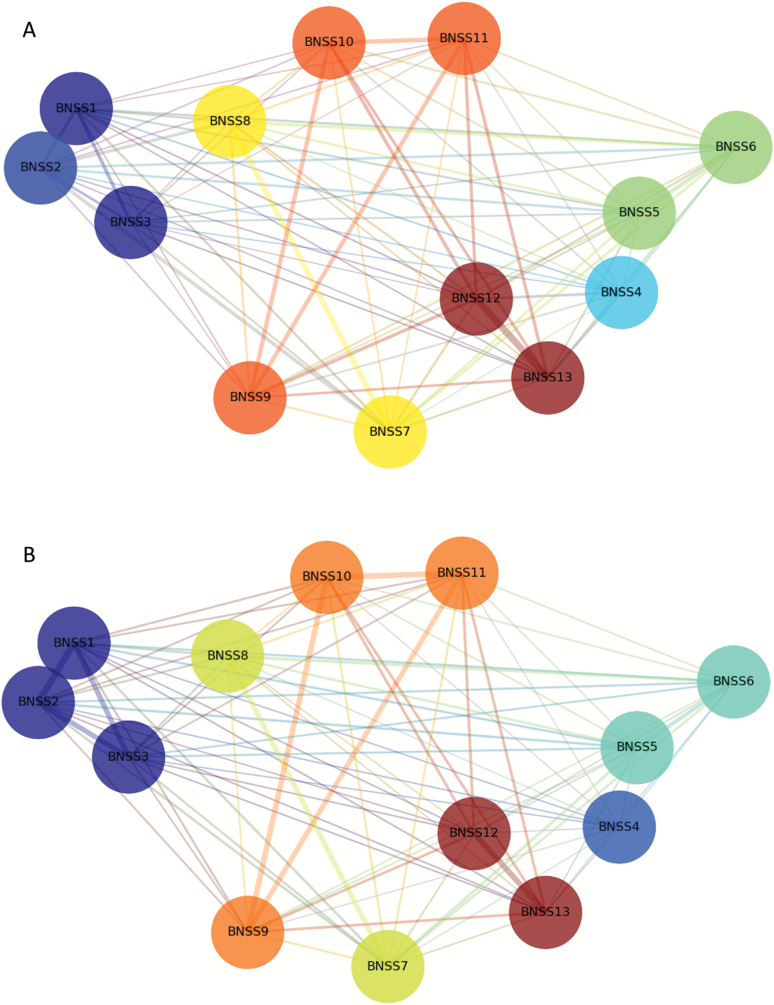
Fig. 1.
Network analysis community detection topographic map. The nodes in the network represent the 13 Brief Negative Symptom Scale (BNSS) items; the node colors represent detected communities by the Louvain method; and the edge width represents the strength of the MI value. BNSS items: 1 = intensity of pleasure during activities; 2 = frequency of pleasurable activities; 3 = intensity of expected pleasure from future activities; 4 = lack of normal distress; 5 = asociality behavior; 6 = asociality internal experience; 7 = avolition behavior; 8 = avolition internal experience; 9 = facial expression; 10 = vocal expression; 11 = expressive gestures; 12 = quantity of speech; 13 = spontaneous elaboration. The 6 negative symptom domains identified by the network analysis are: anhedonia = BNSS items 1–3; lack of normal distress = 4; asociality = 5–6; avolition = 7–8; blunted affect = 9–11; alogia = 12–13. (A) American Sample (Study 1: n = 201); (B) Italian Sample (Study 2: n = 912). For color, please see the figure online.

