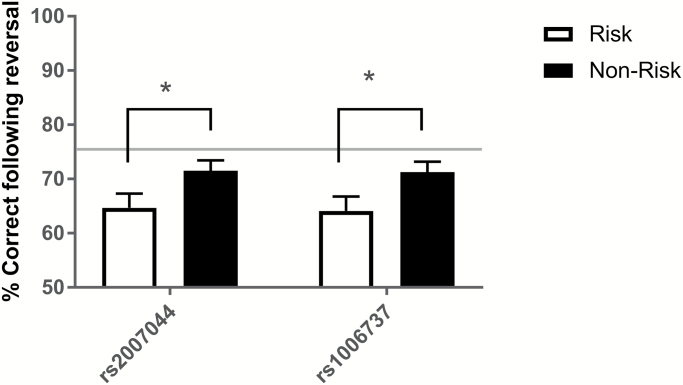
Fig. 3.
Comparison of accuracy following first reversal for risk and non-risk alleles at rs1006737 and rs2007044. Risk allele was associated with significantly reduced performance compared to non-risk allele carriers. Bars represent average % correct. Error bars are standard error of the mean (SEM). *P < .05.

