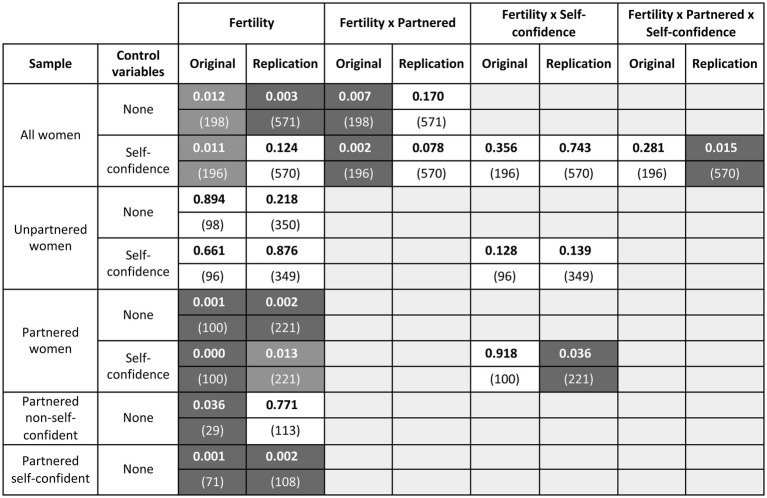
Figure 2.
Visualization of the effect of fertility on women’s preference for single relative to attached men. The figure presents the results of univariate ANOVAs; fertility is reported as a main effect and in its interaction with relationship status and/or self-confidence with men, whenever either factor appears in the analysis. The column “Control variables” indicates whether the ANOVA contains factors other than type of study, album, relationship status, and fertility. For each analysis and effect, the cell indicates the p value (rounded to the first three digits; N within brackets), separately for the original and the replication data. Significant results (p < 0.05) are shown in white on a dark background. Significant main effects that are qualified by an interaction are shown on a lighter gray background. Nonsignificant effects are shown in black on a white background.

