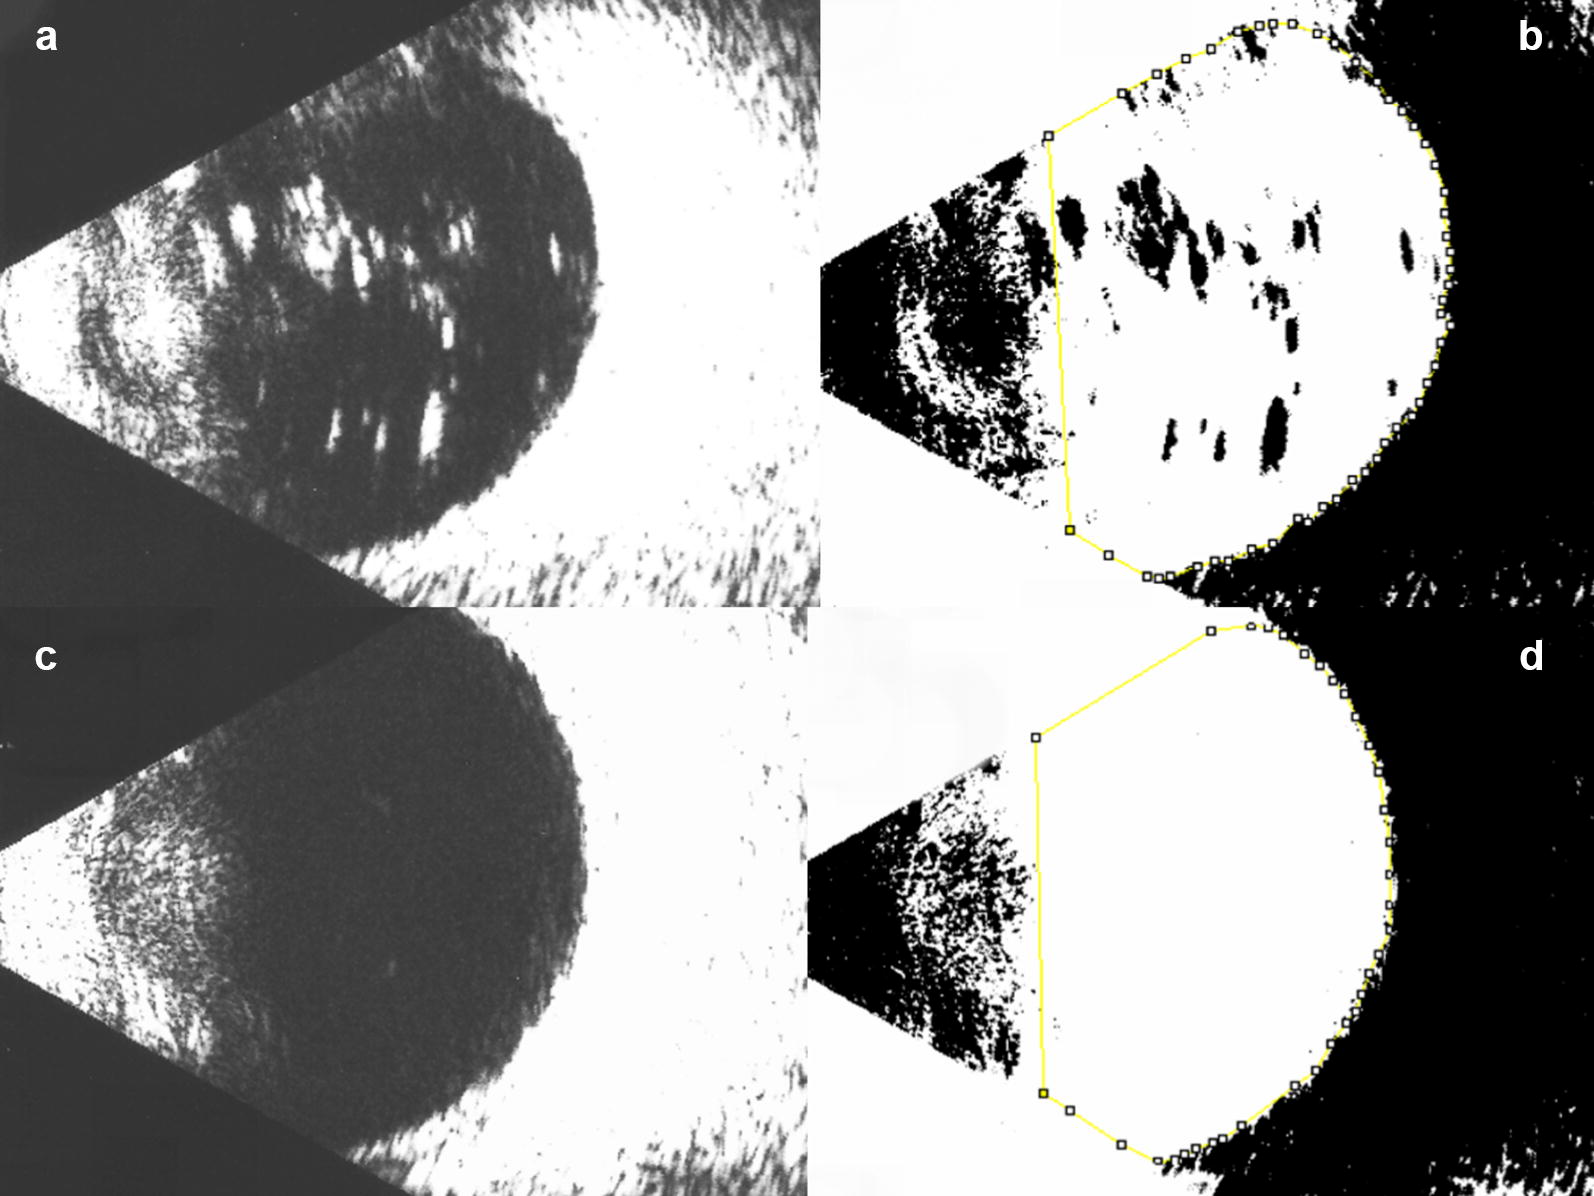
Fig. 2.

Illustration of the image processing using ImageJ to quantify silicone oil droplets. a (Top left): ultrasound image showing an eye previously treated the multiple injections presenting many hyperechoic areas. b (Top right): after binarization, a yellow line demarcates the vitreous borders. The presumed oil droplets are in black. c (Bottom left): ultrasound image of the contralateral, healthy eye of the same subject. d (Bottom right): after binarization of the control eye, only a few black dots can be seen within the demarcated vitreous area (yellow)
