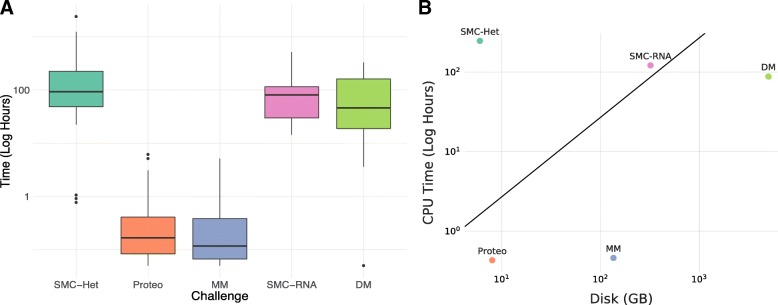
Fig. 3.
a) Distribution of model run times across M2D Challenges. b) Comparison between CPU and disk usage among the M2D Challenges. CPU time is in the total wall time for running a single entry against all test samples used for benchmarking. Disk usage is the size of the testing set in GB. The diagonal line represents the point at which the cost of download egress fees and the cost of compute are equivalent. Below the line a M2D approach is theoretically cheaper

