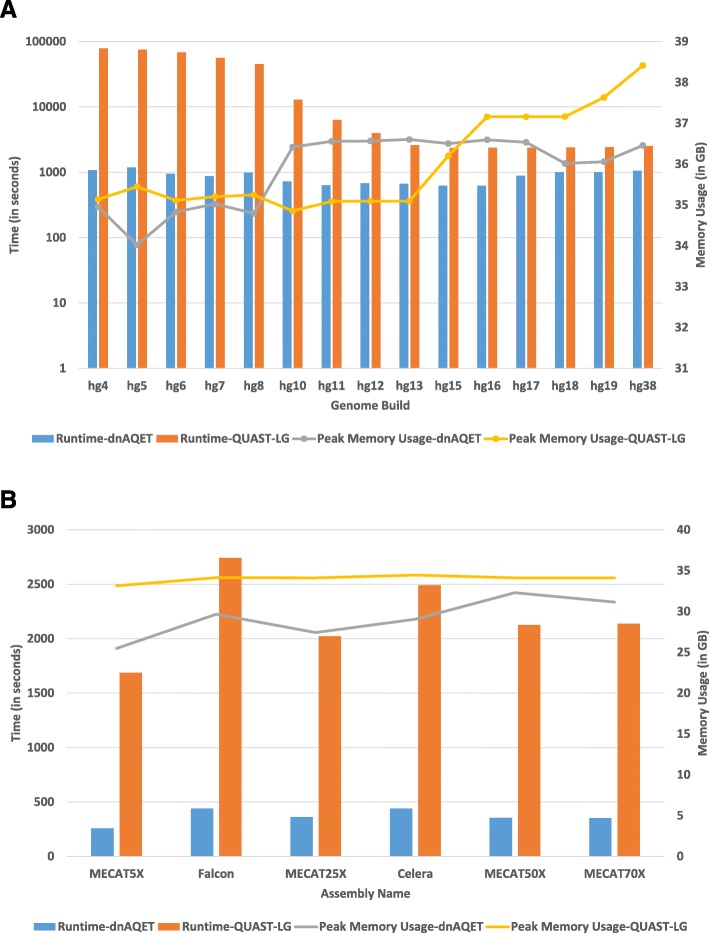
Fig. 5.
Runtime and peak memory usage. The dnAQET (blue bars) and QUAST-LG (orange bars) runtimes to process the human reference genome builds (a) and the six assemblies of NA24385 (b) were plotted as the bars (left y-axis). The peak memory usages (in gigabytes) were plotted in the lines (right y-axis) for dnAQET (gray lines) and QUAST-LG (yellow lines)

