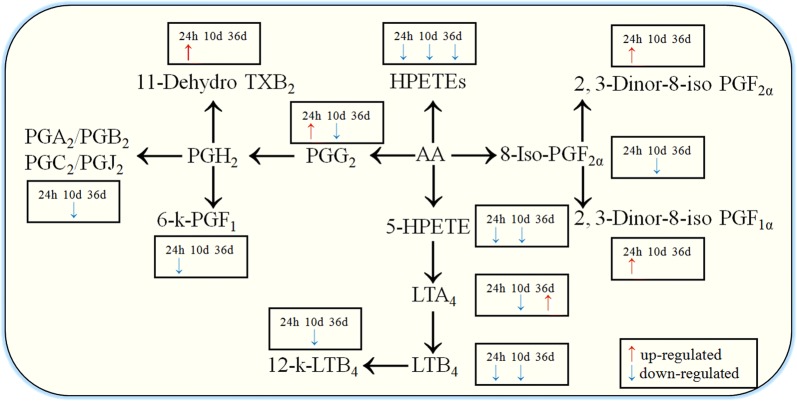
Fig. 6.
Schematic overview of the differential metabolites involved in arachidonic acid metabolites pathway at 12 hpi, 10 dpi and 36 dpi. Red and blue arrows represent upregulation and downregulation, respectively. No arrows indicate that the metabolites were not significantly different in this infection stage

