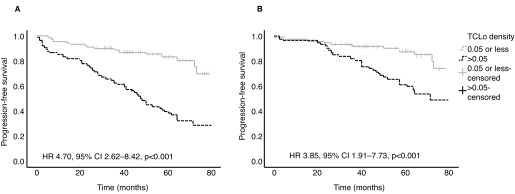
Fig. 1.
Kaplan-Meier curves comparing progression-free survival (PFS) in patients with high (>0.05) or low (≤0.05) total cancer location (TCLo) density. The curves for (A) progression to active treatment and (B) grade progression demonstrate poorer PFS in patients with high TCLo density. CI: confidence interval; HR: hazard ratio.

