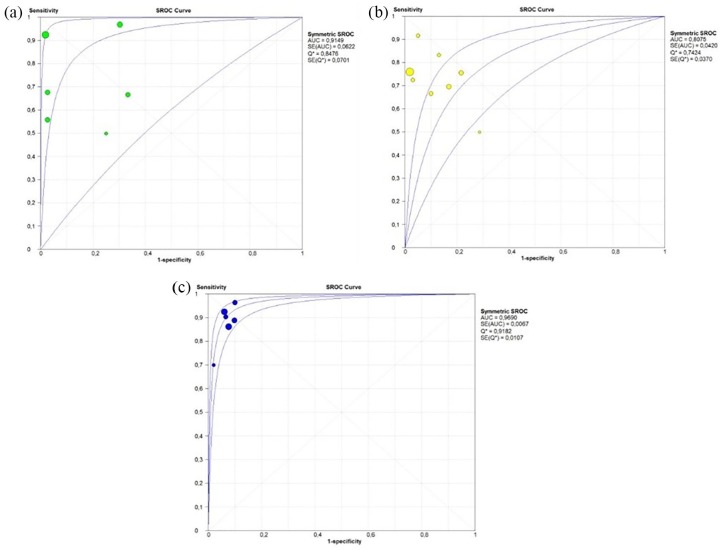
Figure 5.
sROC curve of ctDNA for detection of RAS (KRAS or KRAS/NRAS) mutation according to the different diagnostic methods: Figure 5(a) PCR, (b) NGS, (c) BEAMing.
sROC curve of ctDNA for detection of RAS (KRAS or KRAS/NRAS) mutation according to the different diagnostic methods: Figure 5(a) PCR, (b) NGS, (c) BEAMing. The different circle size indicates the different weight of the study.

