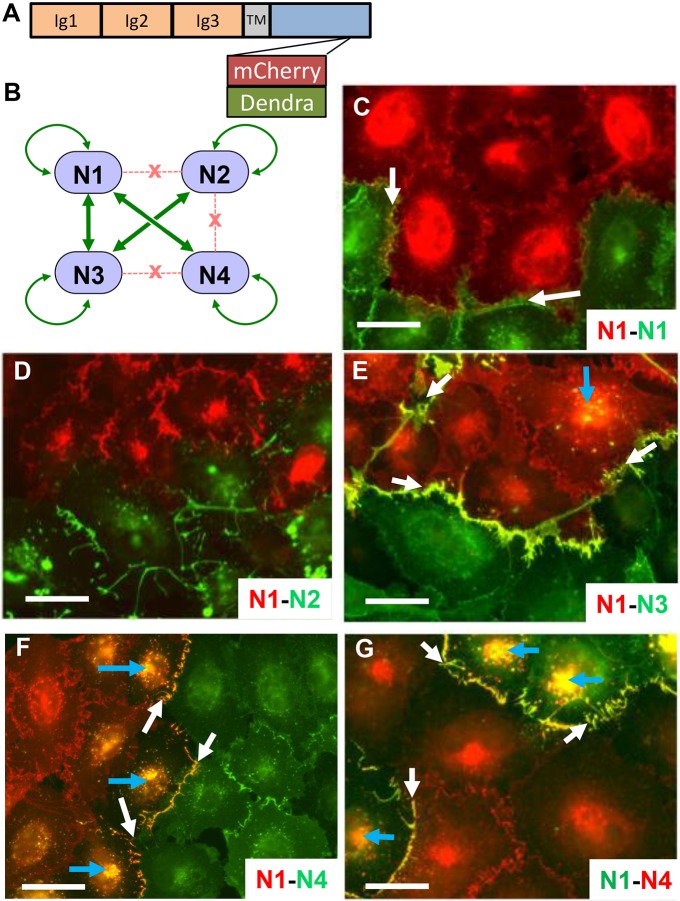
Fig. 1.
Intercellular transfer of nectins. (A) Schematic showing the fluorescently tagged nectin constructs used here. Fluorescent tags were inserted upstream of the afadin-binding site located at the C-terminus of the cytoplasmic region (Kurita et al., 2011; Reymond et al., 2001). TM, transmembrane segment. (B) Interactions among nectins. Binding strengths were determined previously (Harrison et al., 2012). Gene name and main synonyms: N1, NECTIN1 (PVRL1, PRR1, HVEC, HigR, CD111); N2, NECTIN2 (PVRL2, PRR2, HVEB, CD112); N3, NECTIN3 (PVRL3, PRR3, CD113); N4, NECTIN4 (PVRL4, PRR4, LNIR). (C–F) Discovery of intercellular nectin transfer. N1–mCherry-expressing A431D cells co-cultured with A431D cells expressing N1–, N2–, N3– or N4–Dendra2, as indicated in the bottom right corners. Merged red and green signals are shown in yellow. White arrows point at colocalization signals at cell adhesion sites, blue arrows at internal colocalization signals. (G) Swap of fluorescent tags has no effect on direction of transfer. N1–Dendra2-expressing A431D cells co-cultured with N4-mCherry-expressing A431D cells. Scale bars: 40 µm.

