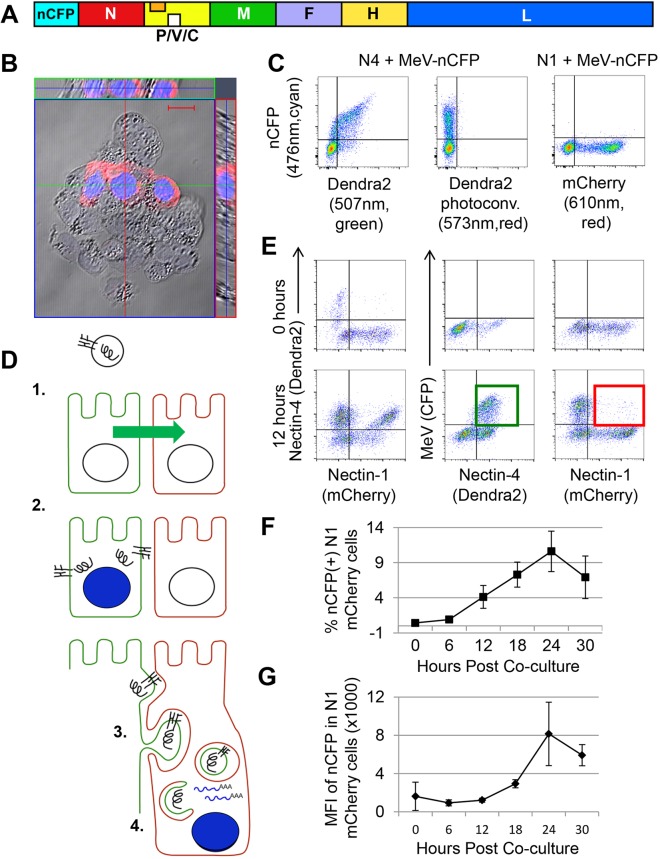
Fig. 4.
Transferred viral RNP remain functional in acceptor cells. (A) Schematic of the recombinant MeV–nCFP genome. The additional transcription unit expressing nCFP is inserted before the nucleocapsid (N) gene. (B) Nuclear localization of nCFP, which emits cyan fluorescence. H358 cells were infected with MeV–nCFP and imaged at 48 h post inoculation. Cytoplasmic N protein was visualized with a secondary antibody emitting red fluorescence. Scale bar: 20 µm. (C) MeV–nCFP infects only N4-expressing cells. N4–Dendra2 (left and center panel)- and N1–mCherry (right panel)-expressing cells were incubated with MeV–nCFP (MOI=2), and CFP expression was analyzed 12 h later. The center panel serves as a control for Dendra2 photoconversion in MeV–nCFP-infected cells. Emission maximum of the fluorescent proteins and filters are indicated. (D) Proposed steps in the RNP transfer process, and experimental approach to measure RNP transfer. (1) N4-expressing cells are shown in green, N1-expressing cells in red. An enveloped viral particle (top) is shown with the H and F glycoproteins inserted in its membrane and a helical RNP. (2) Viral particles enter only N4-expressing cells, where they produce cytoplasmic RNPs, glycoproteins that are transported to the cell membrane, and nCFP that is concentrated in the nucleus. (3) N1-expressing cells internalize membranes of N4-expressing cells that include viral glycoproteins and enclose the RNPs (top); double-membrane vesicles with an RNP cargo are formed (center); fusion between the two membranes occurs (close to bottom). (4) RNPs released in the cytoplasm of the acceptor cell are transcriptionally active, resulting in nCFP expression and nuclear concentration. (E) RNP transfer experiment. N4–Dendra2-expressing A431D cells were infected (MOI=2) and allowed to settle for 4 h; N1–mCherry-expressing cells were overlaid at a 1:1 ratio. Cells were analyzed either immediately after mixing (0 h, top row), or after 12 h of co-culture (bottom row). The three-color FACS analyses are shown in two-color combinations; for details see text. (F) Percentage of N1-expressing cells infected by MeV, as determined by nCFP expression. (G) Levels of MeV replication in N1-expressing cells, as determined by nCFP expression mean fluorescent intensity (MFI). The graphs in F and G show mean±s.d. of three independent experiments, each one with three technical repeats. The primary data are in Fig. S5.

