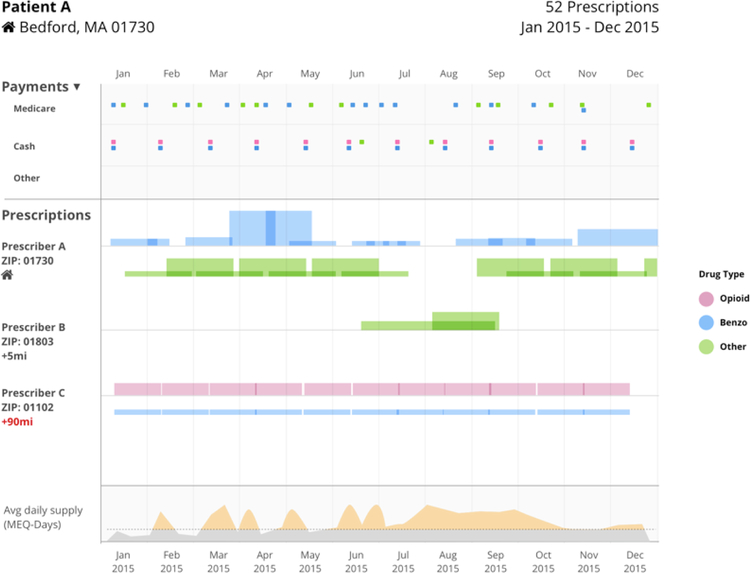
Figure 1.
A sample of the standard prescription drug monitoring report (panel A) and enhanced report (panel B). The information presented was unique to each of the three patient vignettes. Pharmacy names were chosen randomly from local pharmacies, but all prescription and provider data are simulated.


