Fig. 3.
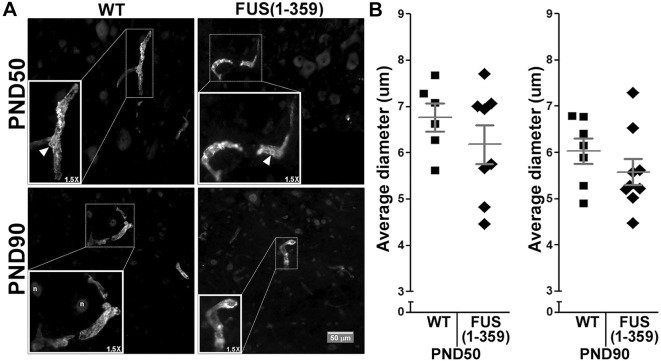
No differences in diameter identified when analysing ASMA+ blood vessels. (A) Representative images from the ventral horn area of lumbar spinal cord tissue from WT (left) and FUS (1-359) (right) transgenic mice obtained at P50 (top) and at P90 (bottom). Insets show magnified view of boxed areas; arrows indicate pericyte cell bodies; n indicates nuclei. (B) Scatter-plot graphs showing the quantified diameter of ASMA+ blood vessels per lumbar ventral horn at P50 [left; WT n=6, FUS (1-359) n=8] and P90 [right; WT n=7, FUS (1-359) n=9]. Each datapoint represents mean diameter from six non-consecutive tissue slices along the lumbar spinal cord, dark grey lines represent mean±s.e.m. t-test between FUS (1-359) and WT groups non-significant in all cases.

