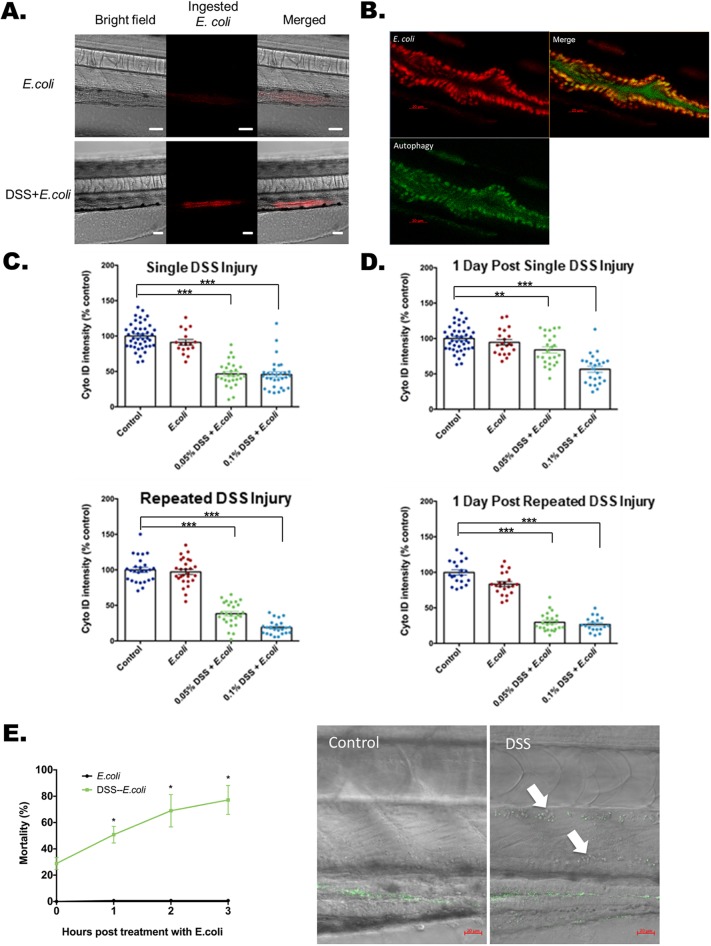
Fig. 2.
Lysosome-rich enterocyte-mediated bacterial protein uptake and autophagy with injury and bacterial exposure. (A) Bright-field, fluorescent and merged images of pHrodo-labeled heat-killed E. coli K12 MG1655 within a zebrafish larval intestine with and without DSS treatment. A total of 20 larva from each experimental condition were treated with the pHrodo-labeled E. coli proteins. The pHrodo dye is a pH-sensing dye indicating ingested E. coli proteins. Scale bars: 50 μm. The quantification is shown at the 0 h time point of Fig. 3G. (B) Uptake of E. coli proteins (red) colocalized with Cyto-ID-positive autophagosomes (green) in intestine. Scale bars: 20 μm. (C) Quantification of Cyto-ID intensities immediately following single (top panel) and repeated DSS injury (bottom panel). DSS [0.05% and 0.1% (w/v)] was applied at the beginning of treatment. ***P<0.001. Error bar, mean±s.e.m. (D) Cyto-ID intensities measured 1 day after DSS treatment shows recovery and non-recovery after single (top panel) and repeated (bottom panel) DSS injury. Altogether for C and D, N=544 from six clutches. ***P<0.001. **P<0.01. Error bar, mean±s.e.m. (E) High levels of mortality with E. coli treatment following single DSS injury. The left panel plots mortality rates at 1, 2 and 3 h after exposure to heat-killed E. coli labeled with Alexa Fluor 488 (green fluorescence) following single DSS injury. *P<0.05, comparing mortality rates at each time point with and without DSS treatment. N=341 from three clutches. Error bar, mean±s.e.m. The right panel shows systemic penetration of E. coli in the dorsal aorta (upper arrow) and posterior cardinal vein (lower arrow) with DSS treatment imaged 90 min after heat-killed E. coli treatment. Scale bars: 20 µm. Full bacterial invasion videos are shown in Movies 6 and 7.

