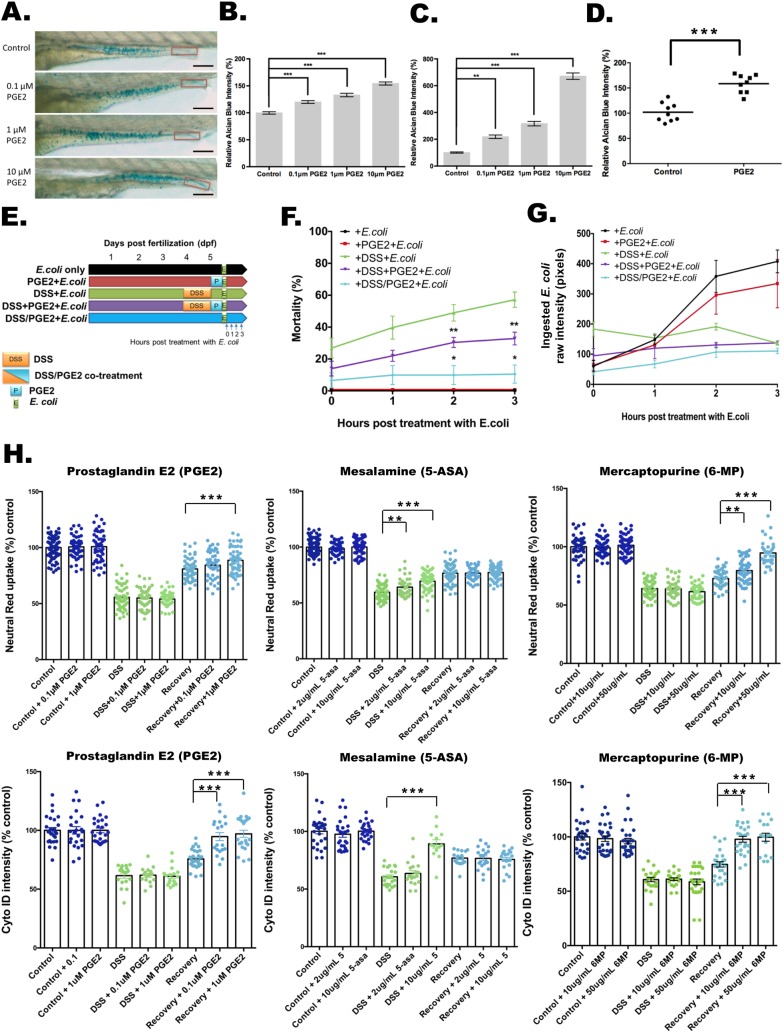
Fig. 3.
Effects of PGE2 and commonly utilized IBD medications on barrier function, bacterial containment and LRE function. (A-C) PGE2 induces mucin expression and release in a dose-dependent manner. (A) The images of Alcian Blue staining with treatments of 0.1, 1 and 10 μM PGE2. The quantification of the whole gut region is shown in B, and the red boxes indicate the quantification areas in C. Scale bars: 100 μm. Alcian Blue intensities of the full intestine (B) and the intestinal lumen (C) are shown (N=100 from three clutches). **P<0.01. ***P<0.001. Error bar, mean±s.e.m. (D) Quantification of relative Alcian Blue intensity in a human enteroid differentiated epithelial monolayer with and without 1 μM PGE2 treatment. ***P<0.001. N=3 patients with three biopsies each. (E-G) Experiment design of DSS and PGE2 treatment (E) for mortality assays (F) or ingested pHrodo-labeled E. coli protein intensity (G). *P<0.05. **P<0.01. N=1145 from nine clutches. Error bar, mean±s.e.m. (G) Fluorescent intensity of ingested pHrodo-labeled E. coli proteins 1, 2 and 3 h after removal from DSS. N=240 from three clutches. Error bar, mean±s.e.m. (H) Applying PGE2 (left panels), mesalamine (middle panels) and 6-mercaptopurine (right panels) to the DSS injury model. The relative Neutral Red (top panels) and Cyto-ID (bottom panels) intensities with treatment alone (dark blue), with treatment during DSS injury for 24 h (light green) and with 5 h of treatment after DSS removal (light blue) are reported relative to untreated controls. **P<0.01. ***P<0.001. Neutral-Red–PGE2, N=505 from three clutches. Neutral-Red–mesalamine, N=695 from six clutches. Neutral-Red–6-mercaptopurine, N=705 from three clutches. Cyto-ID–PGE2, N=196 from three clutches. Cyto-ID–mesalamine, N=189 from three clutches. Cyto-ID–6-mercaptopurine, N=213 from three clutches. Error bar, mean±s.e.m.

