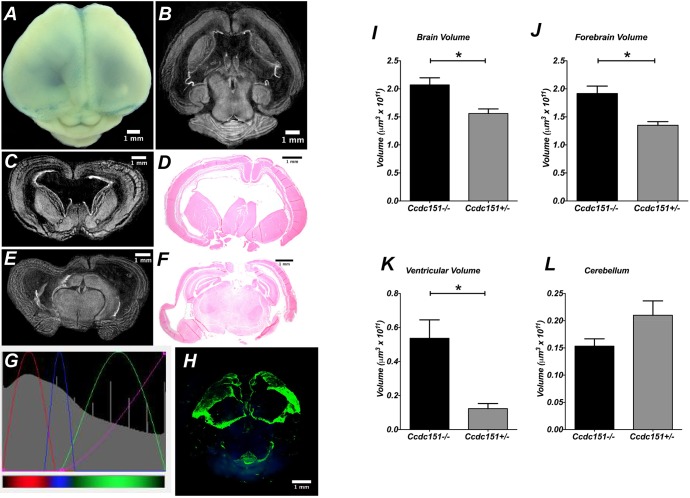
Fig. 4.
Ccdc151-knockout animals develop postnatal hydrocephalus. (A) Dorsal view of mouse brain from homozygous Ccdc151−/− animals stained with the X-gal/FeCN protocol. (B) MicroCT-derived transversal sections of the Ccdc151−/− brain demonstrate enlargement of the lateral ventricles. (C-F) Coronal sections of the Ccdc151−/− knockout brain; microCT-derived coronal sections of the forebrain (C,E) and corresponding histological sections (D,F) demonstrate dilation of lateral ventricles and cortex thinning. (G) Screenshot of the transfer function editor windows of the CTvox analyzer (Bruker software). Settings of the RGB transfer function curves for building a color volume-rendered 3D model, color coded for the tissue density increases: red-blue-green; transparency level defined by the purple line. (H) MicroCT color volume-rendered 3D model of the Ccdc151−/− knockout brains stained with X-gal/FeCN demonstrate highest densities in the ventricular region of the mouse brain. Ependymal cell integrity is interrupted in the dorsal part of the lateral ventricles. (I-L) Quantification of the pathological hydrocephalus of the murine brain of Ccdc151+/− (N=3) and Ccdc151−/− (N=3) at P12. (I) Measurements of the total brain volume; mean+s.e.m.; Mann–Whitney one-tailed t-test, *P=0.05. (J) Forebrain volume; mean+s.e.m.; Mann–Whitney one-tailed t-test, *P=0.05. (K) Ventricular volume; mean+s.e.m.; Mann–Whitney one-tailed t-test, *P=0.05. (L) Cerebellar volume; mean+s.e.m.; Mann–Whitney one-tailed t-test, P=0.09 (non-significant).

