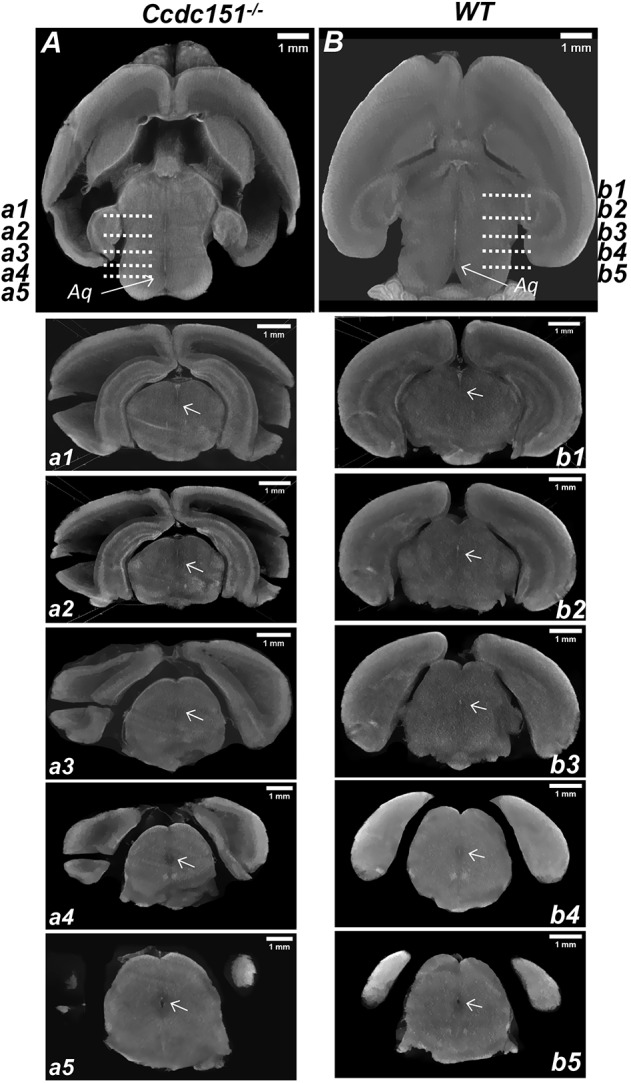
Fig. 6.

MicroCT analysis of continuity of the aqueduct of Sylvius. (A,B) Virtual microCT-derived transversal sections from the brain treated with the Lugol contrasting agent and imaged with a resolution of 6.9 µm voxel size. The continuity of the aqueduct in the brain of Ccdc151−/− (A) and wild-type (WT; B) animals is indicated by an arrow. Sequence of sagittal sections demonstrating aqueduct continuity from the brain of Ccdc151−/− (a1-a5) and WT (b1-b5) animals. Arrows indicate aqueduct.
