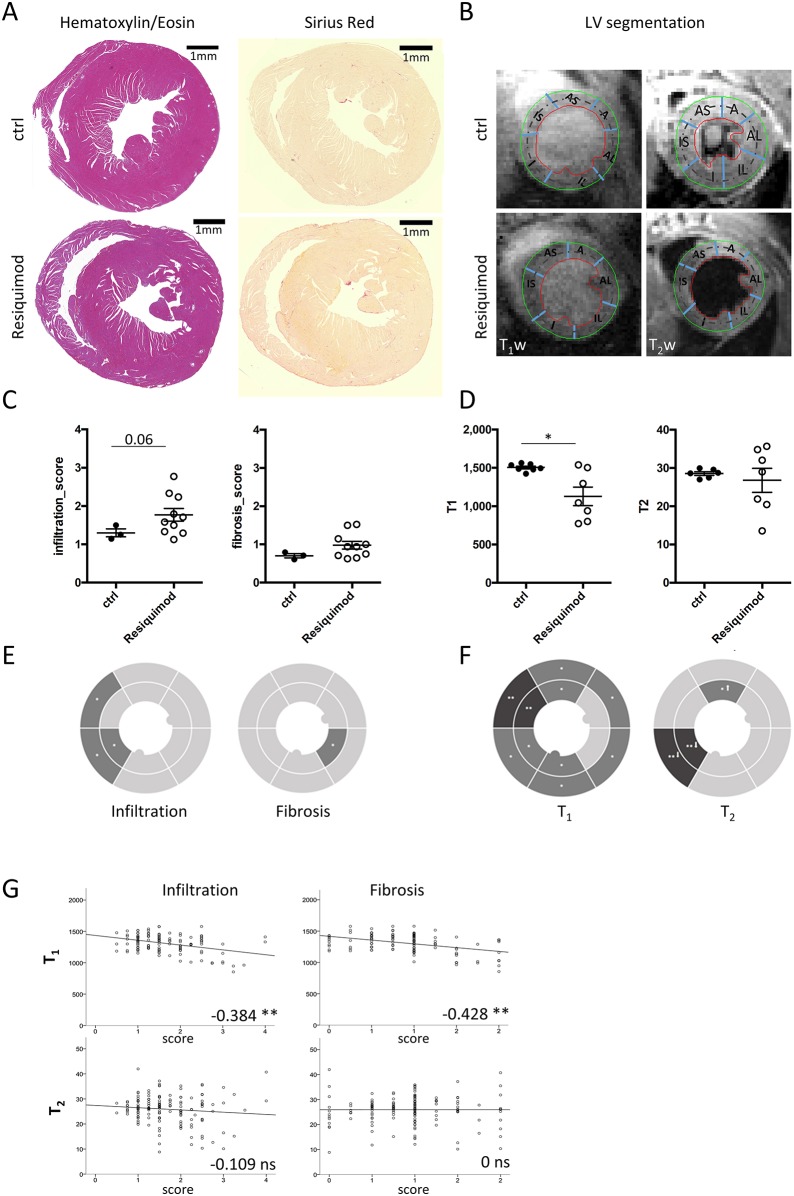
Fig. 2.
Native T1 and T2 tissue mapping does not conclusively detect inflammatory cardiac damage in Resiquimod-treated mice. Heart tissue damage in Resiquimod-treated mice was assessed by histology and MRI. (A) Example of H&E and Picrosirius Red-stained heart sections showing immune cell infiltration and fibrosis. (B) Example of corresponding T1w and T2w images to demonstrate segmentation (A, anterior; AL, anterior lateral; AS, anterior septum; I, inferior; IL, inferior lateral; IS, inferior septum; T1w, T1 weighted; T2w, T2 weighted). (C) Global semiquantitative score for infiltration, fibrosis and RBC extravasation on a scale from 0 to 3, where 0 indicates none and 3 is the most severe. (D) Global values for T1 and T2 values of Resiquimod-treated mice compared with healthy controls. The Mann–Whitney test was used for semiquantitative histopathology scores, n=3 (ctrl), n=10 (treated); paired Student's two-tailed t-test for longitudinal MRI values, n=7; *P<0.05. (E,F) Regional analysis depicted as pie charts performed on 12 segments at mid level per mouse, showing infiltration, fibrosis and RBC accumulation (E), and T1 and T2 (F). Shading indicates significance compared with controls; *P<0.05, **P<0.005. Arrows indicate increase (↑) or decrease (↓) of values compared with controls. (G) Correlation between T1 and T2 indices with individual histopathology scores. Pearson's correlation was used, pooling data from three independent experiments, n=10-12 (ctrl), n=9-10 (treated); *correlation significant at the 0.01 level, **correlation significant at the 0.05 level. Symbols represent individual animals; all data presented as mean±s.e.m.

