Fig. 3.
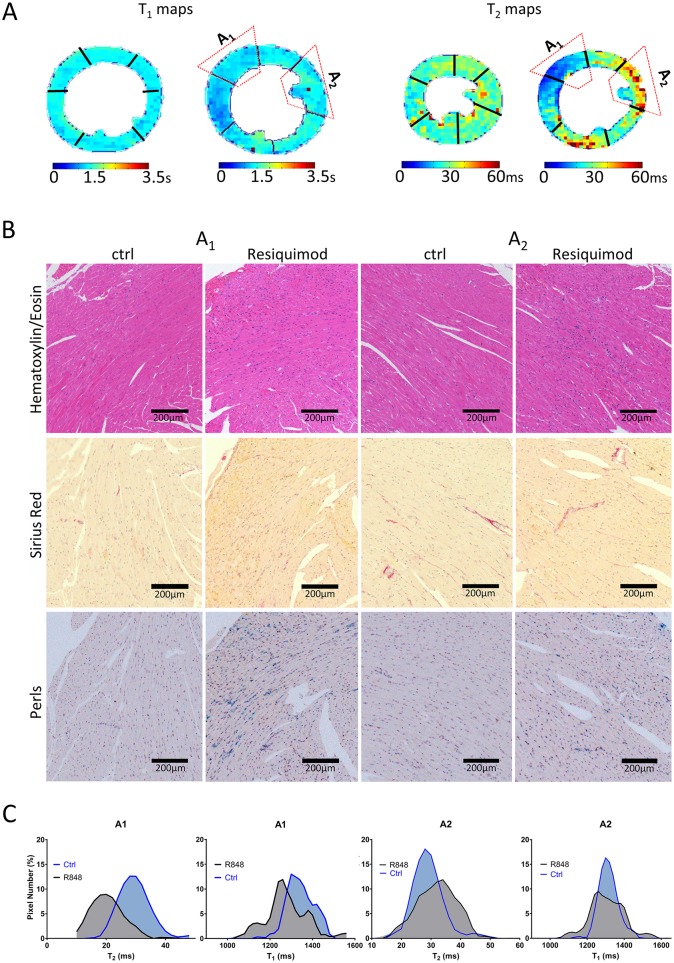
Regional T1 and T2 mapping is strongly influenced by iron deposition in the tissue. Heart tissue damage was assessed by histology and MRI. (A) T1 and T2 maps illustrating heterogeneity of T1 and T2 relaxation times with regions of low T1, T2 (A1) and high T2 (A2). (B) Corresponding areas of interest (A1 and A2) in paraffin-embedded heart sections stained with H&E, Picrosirius Red and Perls Prussian Blue. (C) Histograms of signal distribution of T1 and T2 indices from regions of interest A1 and A2.

