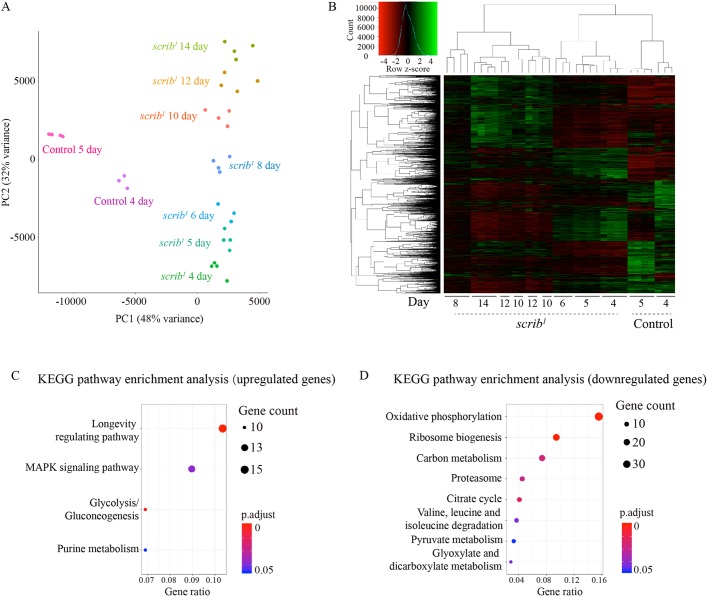
Fig. 2.
The scrib mutant tumors from different stages display distinctive global transcriptomic signatures. (A) PCA of transcriptomes from control and scrib mutant wing imaginal discs collected at different ages. Control genotype was FRT82B. Three or four biological replicates were plotted for each time point. Low-expression genes were filtered using a cutoff of baseMean>100 calculated in DEseq2. A matrix of 6901 gene counts×34 samples was used to compute PCA after gene counts were transformed using the default DEseq2 rlogTransformation function. (B) Hierarchical clustering of transcriptomes from control and scrib mutant wing imaginal discs collected at different ages. Control genotype was FRT82B. Three or four biological replicates were plotted for each time point. Gene filtering criteria were the same as for A. A matrix of 6901 gene counts×34 samples was used for hierarchical clustering after gene counts were transformed to counts per million (cpm) value using the edgeR cpm function and scaled using the scale function in R. (C,D) KEGG pathway enrichment analysis for the top 10% of upregulated genes (C) and the bottom 10% of downregulated genes (D) over time with a cutoff of adjusted P-value <0.05. The pathway enrichment analysis was performed using enrichKEGG function in the clusterProfiler package.

