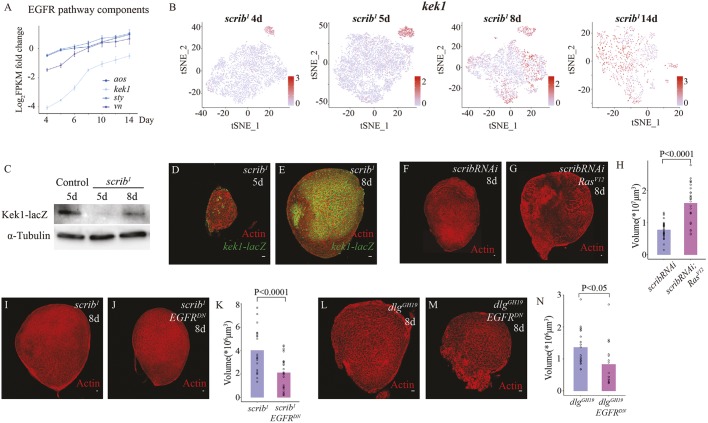
Fig. 4.
ERK signaling activity increases over time and promotes growth of late-stage scrib mutant tumors. (A) Expression levels for aos, kek1, sty, the EGFR signaling activity reporter genes, and vn, an EGFR signaling ligand, in scrib mutant tumors normalized by the respective expression level in control imaginal discs at 5 days AEL using log2(FPKM fold change) values. Control genotype was FRT82B. (B) t-SNE projection of scrib1 mutant cells at 4, 5, 8 and 14 days AEL, where individual cells are colored by the normalized expression level of kek1. The gene expression level normalization was performed using the default LogNormalize method in Seurat. (C) Western blot analysis of β-galactosidase protein level in control imaginal discs at 5 days AEL and in kek1-lacZ; scrib1 mutant wing imaginal discs at 5 and 8 days AEL. Control genotype was kek1-lacZ/+; scrib1/TM6B. (D,E) kek1-lacZ; scrib1 mutant tumors at 5 (D) and 8 (E) days AEL, stained for β-galactosidase (green) and actin (red). (F,G) scrib RNAi (F) and scrib RNAi RasV12(G) imaginal discs at 8 days AEL, stained for actin (red). Genotype for F was c855a-Gal4/UAS-scrib RNAi, n=32, 8±3×106 μm3. Genotype for G was UAS-RasV12/+; c855a-Gal4/UAS-scrib RNAi, n=28, 1.6±0.7×107 μm3. (H) Quantification of the tumor volumes. (I,J) scrib1 (I) and scrib1 EGFRDN (J) imaginal discs at 8 days AEL, stained for actin (red). Genotype for (I) was c855a-Gal4 scrib1/scrib1, n=21, 4±2×106 μm3. Genotype for J was UAS-EGFRDN/+; c855a-Gal4 scrib1/ scrib1, n=31, 2±1×106 μm3. (K) Quantification of the tumor volumes. (L,M) dlgGH19 (L) and dlgGH19 EGFRDN (M) imaginal discs at 8 days AEL, stained for actin (red). Genotype for L was dlgGH19/Y; c855a-Gal4/+, n=21, 1.4±0.6×106 μm3. Genotype for M was dlgGH19/Y; UAS-EGFRDN/+; c855a-Gal4/ UAS-EGFRDN, n=18, 8±7×105 μm3. (N) Quantification of the tumor volumes. All statistical analyses were performed by unpaired t-test. Scale bars: 10 μm.

