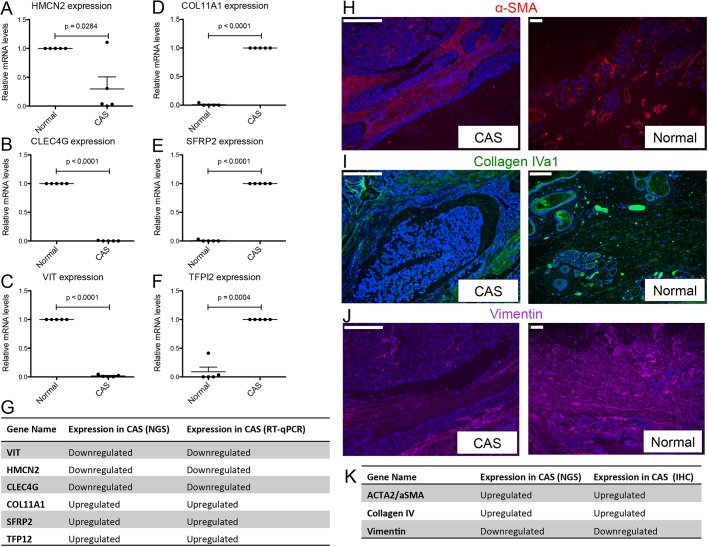
Fig. 2.
Immunohistochemistry and RT-qPCR validation of selected genes from the carcinoma dataset. (A-F) Relative mRNA levels of CAS-associated genes in normal stroma and CAS isolated by LCM, measured using RT-qPCR: HMCN2 (A); CLEC4G (B); VIT (C); COL11A1 (D); SFRP2 (E); TFPI2 (F). Data are mean±s.e.m., normalised to expression levels in normal stroma (for HMCN2, CLEC4G and VIT), or CAS (COL11A1, SFRP2, TFPI2), respectively. P-values were calculated using student's t-test, and significance cutoff was set at P=0.05. (G) Summary of the expression trends as detected by RT-qPCR and RNAseq. (H-J) Immunofluorescent staining of α-SMA (red, H), collagen IV (green, I) and vimentin (purple, J) in CAS and normal stroma of a representative canine simple mCA sample. DAPI staining (blue) visualises cell nuclei, and marks large densely blue areas in the left panels as tumour cells, while demarcating normal mammary glands in the panels on the right. (K) Summary of the expression trends as detected by RNAseq or immunofluorescence. Scale bars: 200 μm.

