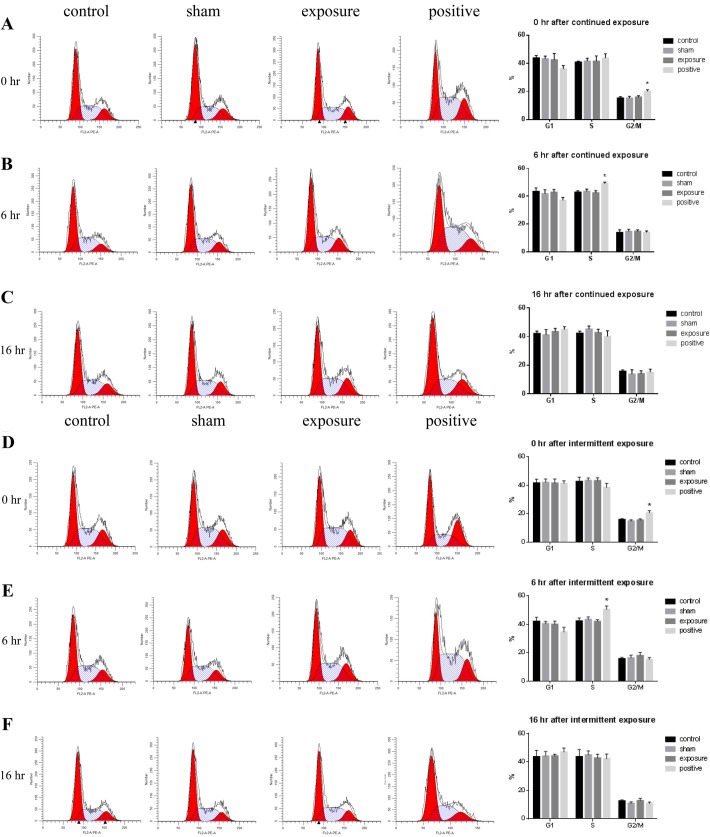
Fig. 2.
Effects of exposure to 50 Hz MF on cell cycle distribution in AC16 cells. The proportions of cells at each phase of the cell cycle were measured by flow cytometry at 0, 6 and 16 h after 50 Hz MF exposure for 1 h continuously (A–C) or 75 min intermittently (D–F), or after 1 μM nocodazole for 1 h as a positive control. Left, representative cell cycle profiles in negative control (control), sham exposed (sham), ELF-MF exposed (exposure) and positive control (positive) groups, from left to right. Right, histograms of percentages of cells at different phases of the cell cycle. The data represent the mean±s.e.m. from three independent experiments (*P<0.05 versus control).

