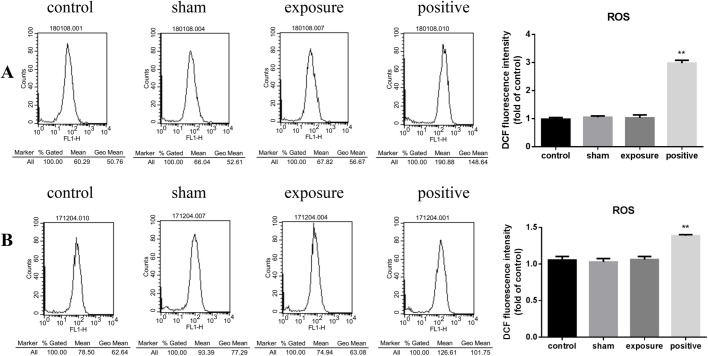
Fig. 3.
ROS generation in AC16 cells exposed to 50 Hz MF. Levels of intracellular ROS were measured by flow cytometry using DCFH-DA after 1 h continuous (A) or 75 min intermittent (B) exposure to 50 Hz MF. Cells treated with 200 μM H2O2 for 30 min were used as positive control. Left, representative cell DCF fluorescence intensity profiles in negative control (control), sham exposed (sham), ELF-MF exposed (exposure) and positive control (positive) groups, from left to right. The vertical axis represents cell numbers, horizontal ordinate is DCF fluorescence intensity. Right, histograms of geometric mean value of DCF fluorescence intensity in each treatment group. The data represent the mean±s.e.m. from three independent experiments (**P<0.01 versus control).

