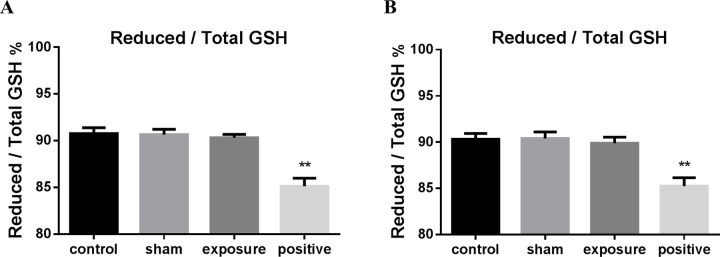
Fig. 4.
The ratio of reduced/total GSH in AC16 cells exposed to 50 Hz MF. Quantitative analysis of reduced/total GSH ratio in negative control (control), sham exposed (sham), ELF-MF exposed (exposure) and positive control (positive) groups after 50 Hz MF exposure for 1 h continuously (A) or 75 min intermittently (B). Cells treated with 200 μM H2O2 for 30 min were used as positive control. The data represent the mean±s.e.m. from three independent experiments (*P<0.05 versus control).

