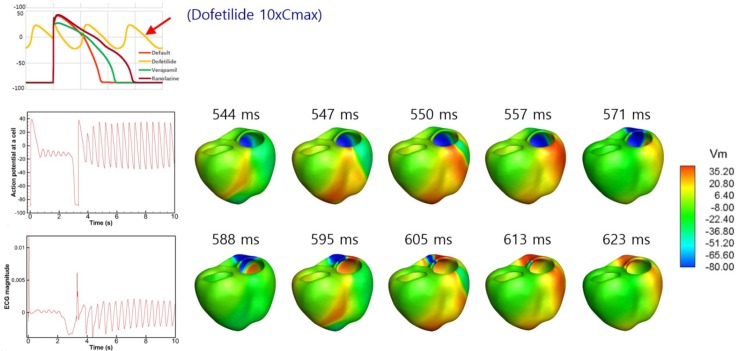
FIGURE 6.
Drug-induced ventricular tachycardia. The action potential from the single-cell model, action potential at a point in the 3D model, and ECG data from the 3D model in the presence of dofetilide at a Cmax value of 10× are shown. Photographs of ventricular action potential propagation are also shown.

