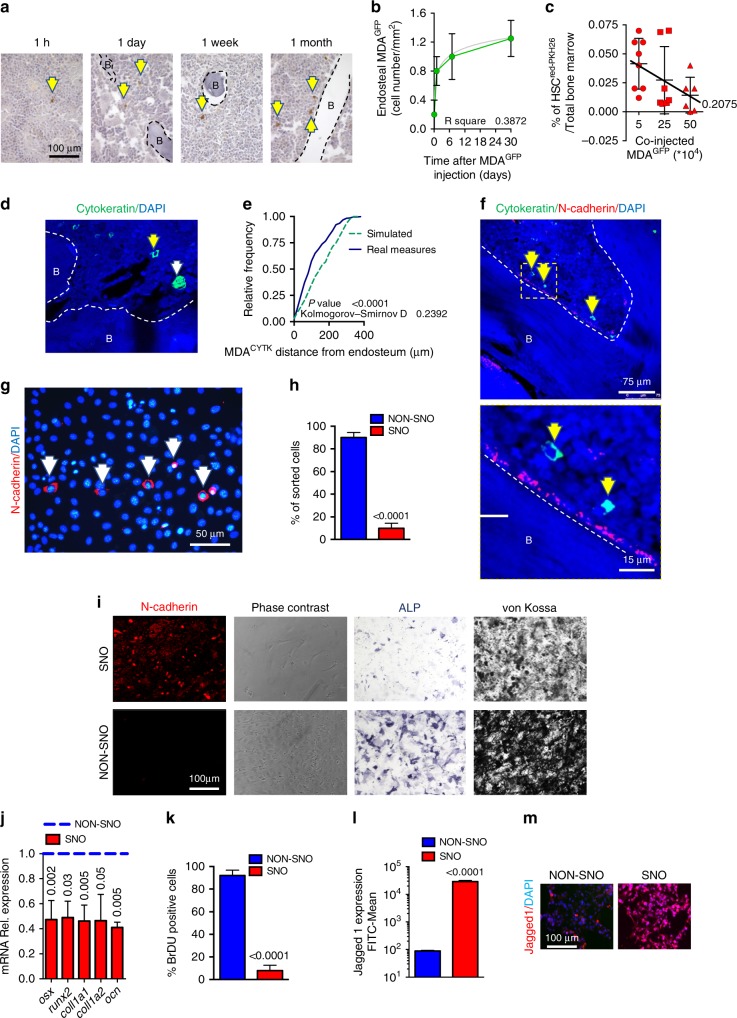
Fig. 1.
Breast cancer cells compete with haematopoietic stem cells (HSCs) for the spindle-shaped N-cadherin+/CD45− osteoblast (SNO) endosteal niche. a CD1 nu/nu mice received an intratibial injection of MDA-MB-231-turboGFP (MDAGFP) cells and were randomly divided into four groups that were sacrificed at the indicated times from cell injection. The number of endosteal breast cancer cells was evaluated in non-consecutive tibia sections and results were normalised by tissue area. Representative images and b quantification of the number of endosteal breast cancer cells/tissue surface. B bone. c Sub-lethally myeloablated CD1 nu/nu mice received an intratibial co-injection of HSCsred PKH26 cells and increasing numbers of MDAGFP cells. Marrow was then flushed out from the bone and subjected to flow cytometric analysis to retrieve HSCredPKH26 cells. d CD1 nu/nu mice received an intratibial injection of MDA-MB-231-Luciferase (MDALUC) cells. After 1 month, mice that did not develop bioluminescence signal, reminiscent of lack of cancer development, were considered positive for dormancy. The tibias were isolated and stained for cytokeratin to detect breast cancer cells. Representative image by confocal laser-scanning microscopy. Yellow arrowhead, single cancer cell; white arrowhead, micro-metastasis. B bone. e Cumulative frequency distribution of MDALUC in the bone marrow (solid line) in comparison with the cumulative frequency distribution of random dots (dotted line). f Representative image by confocal laser-scanning microscopy (upper panel) and yellow square-marked inset (lower panel). Yellow arrowhead, single cancer cell. B bone. g Primary osteoblasts were isolated from mouse calvariae. Representative image by epifluorescence microscopy. White arrowhead, N-cadherin-positive SNOs. h Percentage of magnetic-activated cell-sorted SNOs and NON-SNOs. (i) SNO and NON-SNO characterisation for N-cadherin expression, cell morphology, alkaline phosphatase activity (4-day culture) and mineralisation ability (21-day culture in osteogenic medium; Von Kossa staining). j Real-time reverse transcriptase–polymerase chain reaction for the indicated osteoblast differentiation markers. k Bromo-deoxy-uridine (BrDU) staining. l Flow cytometry for the surface marker, Jagged1. m Jagged1 immunofluorescence. Imaging and data (mean ± SD) represent the results of at least five mice/group or three independent in vitro experiments. Statistical analyses: b non-linear regression analysis and curve fitting, regression curve in grey; c analysis of variance on trend; e Kolmogorov–Smirnov test; (h, j–l) two tails’ unpaired t test. DAPI, nuclear staining

