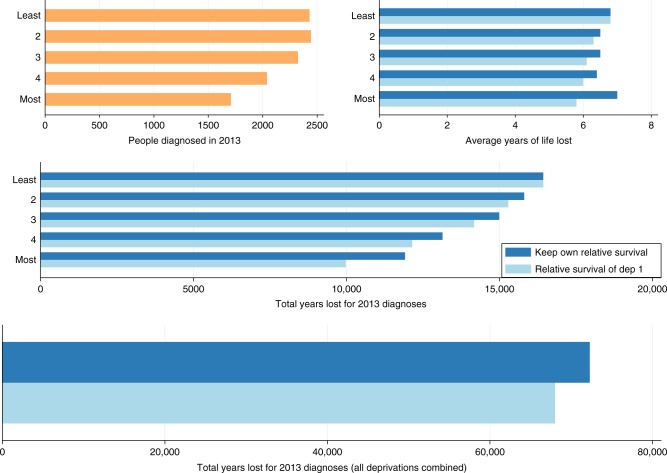
Fig. 1.
Number of male patients diagnosed with colon cancer in 2013, the average life years lost and the total years lost by deprivation group (1 for the least deprived and 5 for the most deprived patients) as well as total years lost for all deprivation groups combined (plot in the bottom) under two scenarios (i) if each group had their own relative survival (dark blue bar) and (ii) if each groups had the relative survival of the least deprived group (light blue bar)

