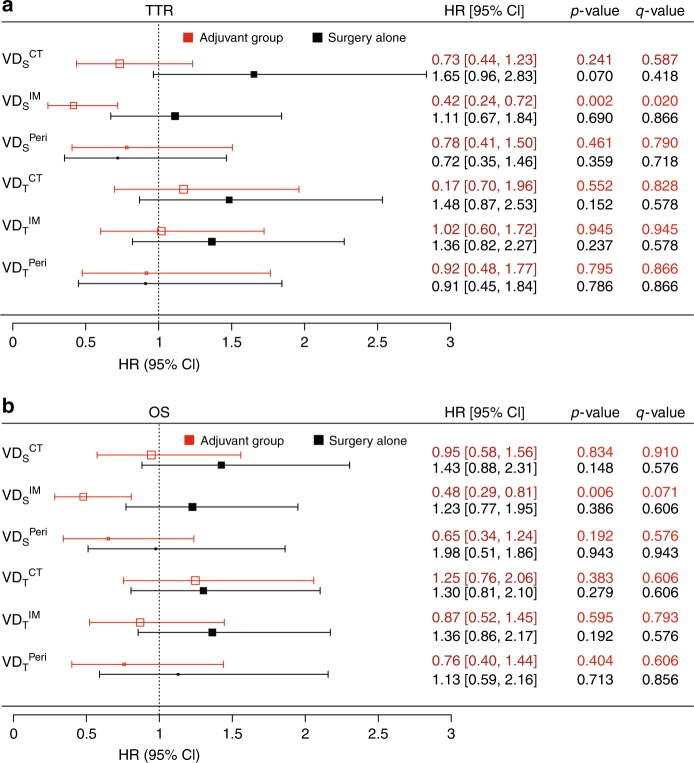
Fig. 2.
Associations between VD and survival rates in stage II/III colon cancer in the discovery cohort. Plot illustrating the hazard ratios (squares on the graph and values on the right) and 95% CI (whiskers and values in the square parentheses), derived from Cox-regression analyses, for TTR (a) and OS (b) in the adjuvant chemotherapy group (red) and surgery-alone group (black). P-values, adjusted for multiple testing, are shown as q-values

