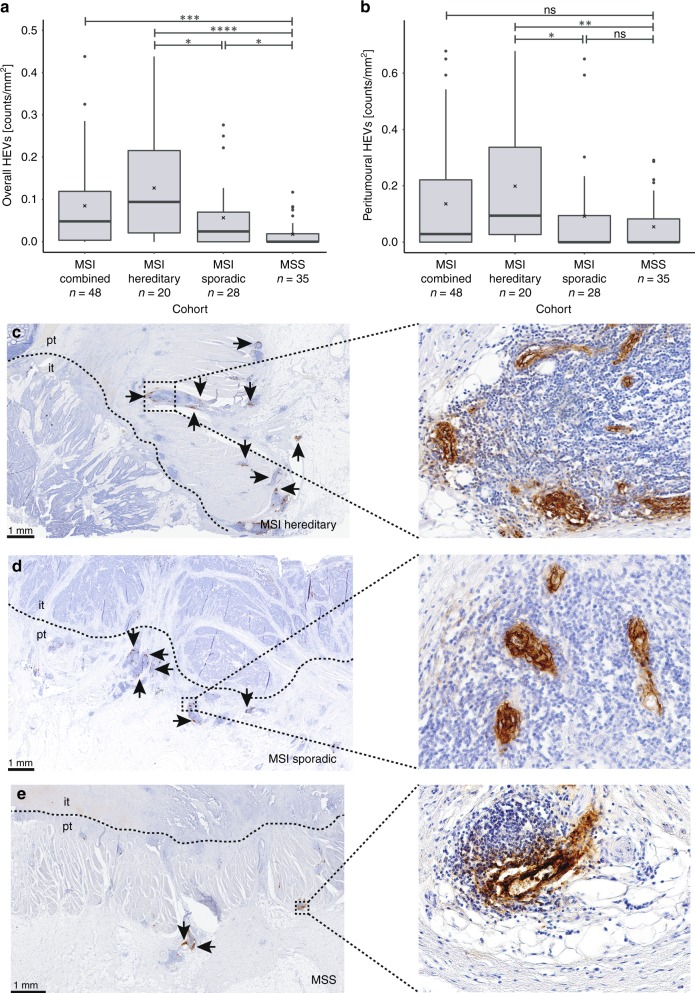
Fig. 1.
HEV density in sporadic MSI, hereditary MSI and MSS CRC samples. a Overall HEV density. MSI CRCs showed significantly elevated HEV densities as compared with MSS CRCs (p = 0.0002). Comparing MSI hereditary and sporadic MSI or MSS CRCs revealed a significantly elevated HEV density in hereditary MSI CRCs (p = 0.0255 and p = 3.9 × 10⁻⁵, respectively). MSI sporadic CRCs also showed significantly elevated HEV densities as compared with MSS CRCs (p = 0.0159). b Peritumoural HEV density. Considering only peritumoural HEVs, MSI CRCs with Lynch syndrome background revealed elevated HEV densities within this group, as compared with MSI sporadic and MSS (p = 0.010 and p = 0.0018, respectively). Black lines in boxes indicate the median value; cross indicates the mean value. Significance levels are depicted with asterisks (*p ≤ 0.05, **p ≤ 0.01, ***p ≤ 0.001, ****p ≤ 0.0001). c Representative image for HEV staining in MSI CRC of hereditary origin, d image for HEV staining in MSI CRC of sporadic origin and e presents HEV staining in MSS CRC. The boundary between the intratumoural (it) and peritumoural (pt) area is marked by a dashed line. Scale bar in c–e is 1 mm and HEVs are indicated by black arrows. All p-values were obtained from a nonparametric Wilcoxon rank-sum test

