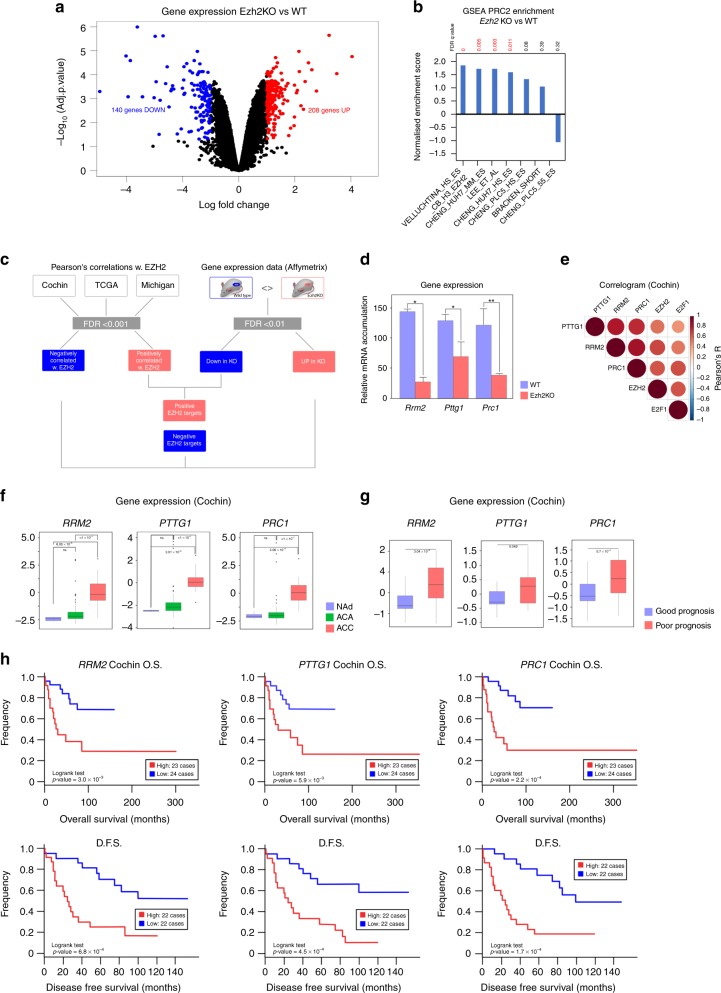
Fig. 2.
Identification of EZH2 target genes. a Differential gene expression was evaluated by micro-array analysis in a mouse model of adrenal-specific inactivation of Ezh2, compared with wild-type mice.15 Volcano plot represents Log Fold Change and –Log10 of adjusted p-value (FDR) for four knockout compared with three wild-type adrenals. Red dots show genes significantly up-regulated in knockout compared with wild-type adrenals. Blue dots show genes significantly down-regulated in knockout compared with wild-type adrenals. b GSEA evaluation of PRC2 targets enrichment in differentially expressed genes. c Strategy for identification of EZH2 targets in ACC by intersection of patients’ correlation data with mouse gene expression data. d Expression levels of the three identified positive target genes (RRM2, PTTG1, PRC1) were determined by RTqPCR in eight wild-type and eight Ezh2 knockout adrenals. Bars represent the mean ± SEM. Statistical analysis was conducted by Wilcoxon’s test. *p < 0.05, **p < 0.01 e Correlogram shows correlation of expression of RRM2, PTTG1 and PRC1 with expression of EZH2 and E2F1 in Cochin’s cohort. f Expression of RRM2, PTTG1 and PRC1 in normal adrenals, adrenocortical adenomas and adrenocortical carcinomas. Significance was evaluated by ANOVA. g Expression of RRM2, PTTG1 and PRC1 in the groups of good (blue) and poor (red) prognosis in Cochin’s cohort. Significance was evaluated by Wilcoxon’s test. h Overall (O.S) and disease-free (D.F.S) survival as a function of RRM2, PTTG1 and PRC1 expression in Cochin’s cohort. Statistical significance was evaluated by the Logrank test

