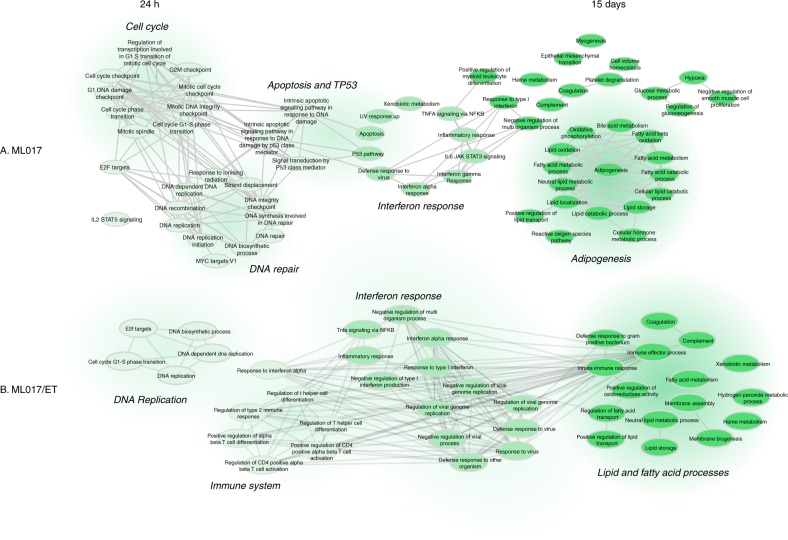
Fig. 3.
Biological process networks. Functional analysis of ML017 (a) and ML017/ET tumours (b) 24 h after the first dose and 15 days after the third dose of trabectedin. Functional analysis is described in Materials and methods. Only significant pathways are shown. Light green is related to 24 h, dark green to 15 days. Medium green highlights pathways shared by both 24 h and 15 days. Edges are built based on the presence of genes for each pair of pathways

