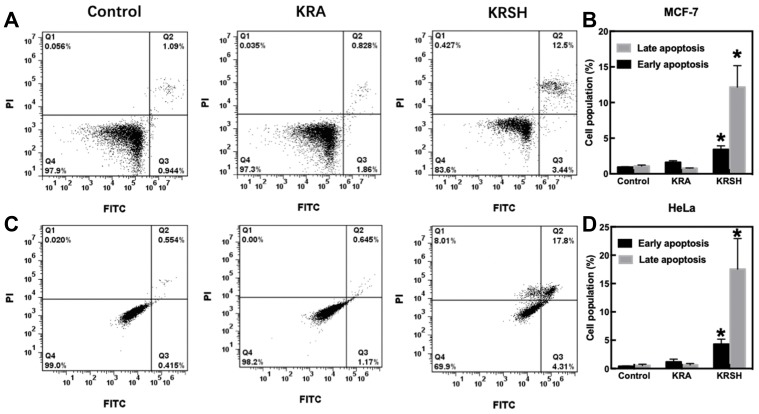
Figure 6.
Cell apoptosis after incubation with 50 nM KRA and the KRSH peptide for 24 h. (A) Apoptosis in MCF-7 cells was distinguished through FITC-Annexin V coupled with PI staining. (B) The corresponding quantification of early and late apoptosis in MCF-7 cells. (C) Apoptosis in HeLa cells was determined using a flow cytometer, and the data analysis is displayed in (D). *p<0.05, compared with control cells cultured in complete medium, one-way ANOVA).
Abbreviations: FITC, fluorescein isothiocyanate; ANOVA, analysis of variance.

