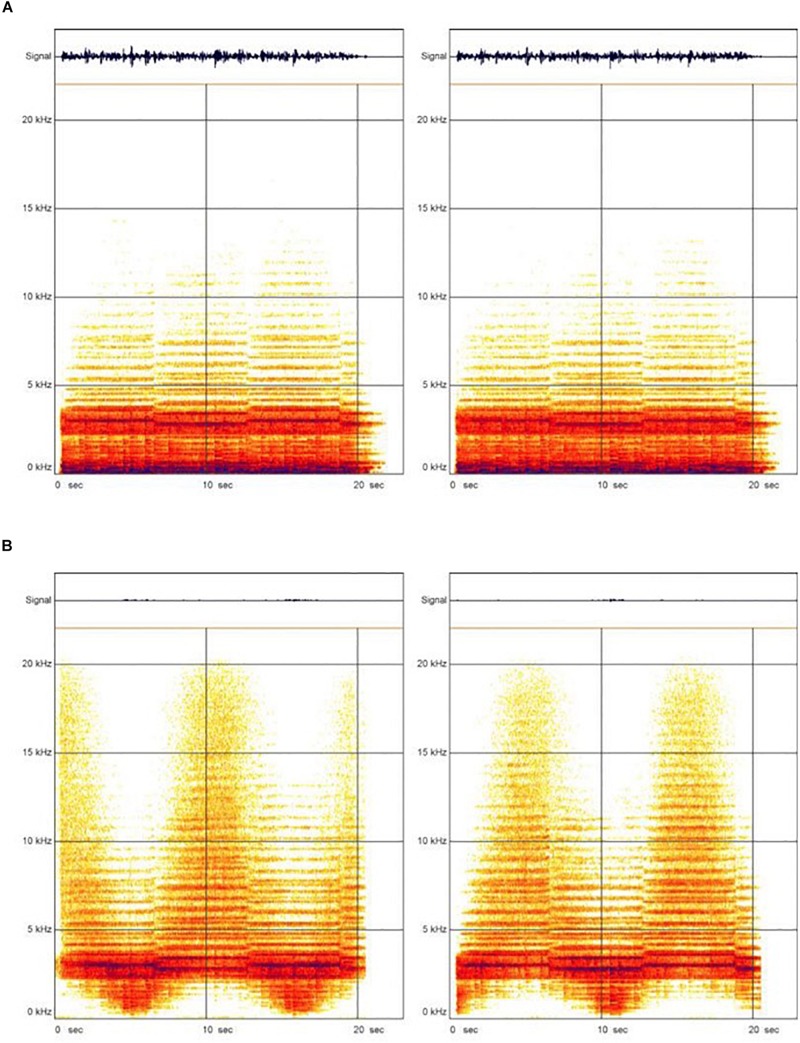
FIGURE 1.
Visualization of the frequency spectrum of the ASTM. Condition (A) represents the visualization of the frequency spectrum of the ASTM with unmanipulated music. The dark area represented the sound volume of the orchestra, the brighter area were the solo instruments. The horizontal stripes that emerged were the natural overtones of the violins. Condition (B) showed the frequency spectrum with manipulated music, where high and medium frequencies (>2000 Hz) are compressed at intervals. Moreover, the medium and high frequencies were lateralized in a way that they were strongly condensed on the left ear while being shut down on the right ear at the same time and vice versa.

