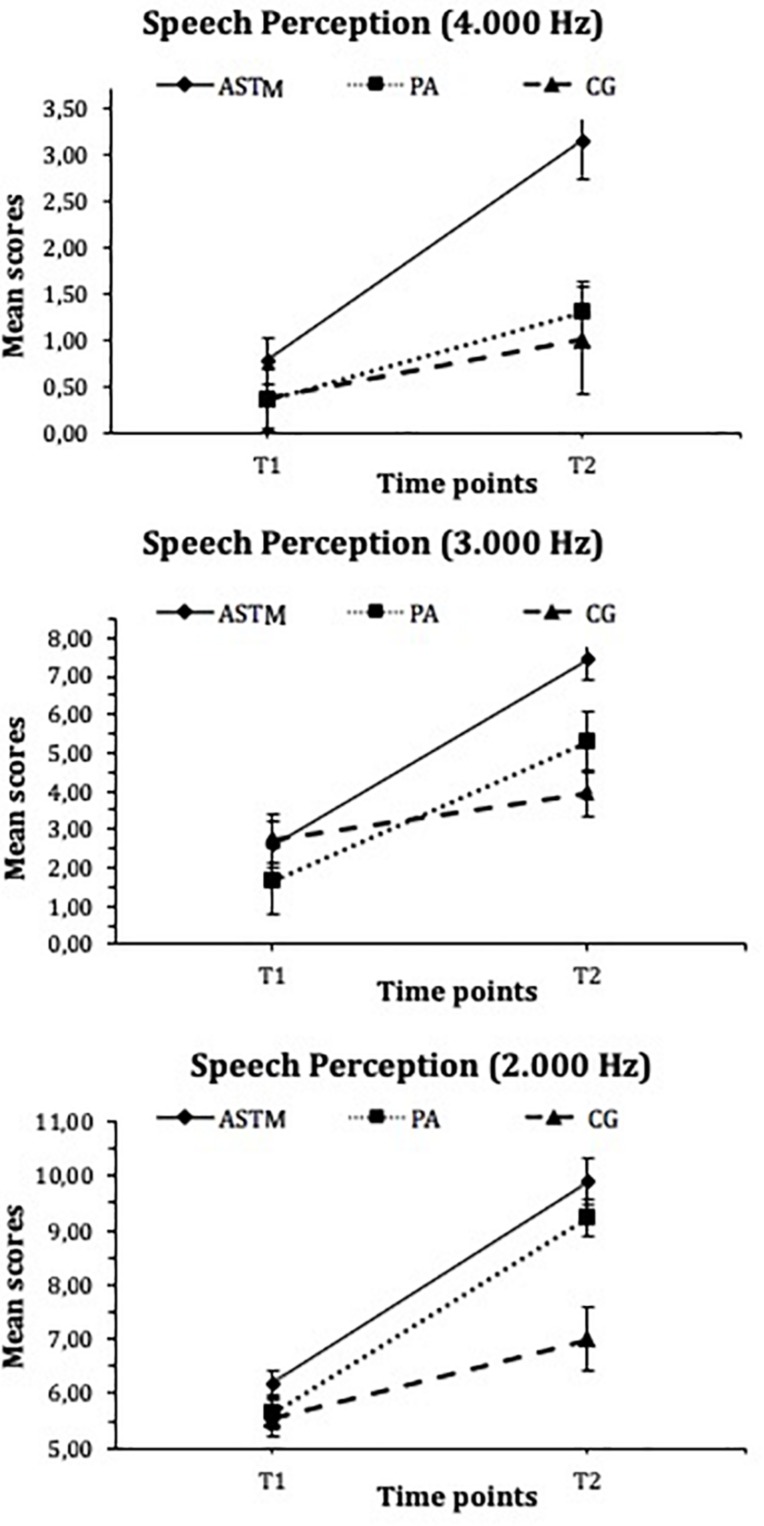
FIGURE 4.
Mean scores for Speech Perception (4.000, 3.000, and 2.000 Hz] for the auditory stimulation training with technically manipulated musical material group (ASTM], the pedagogical activity group (PA], and the control group (CG) at Tl and T2. Error flags indicate standard error of means (SEM).

