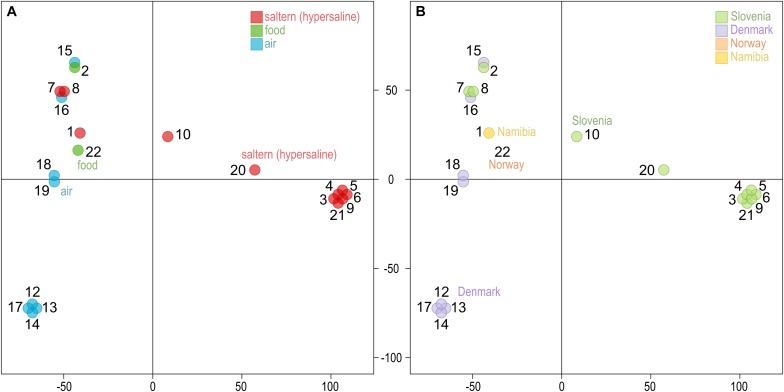
FIGURE 1.
Clustering of the Wallemia ichthyophaga genomes. Principal component analysis of SNP data estimated by comparing the genomes sequenced in this study to the reference genome. The genomes are represented by circles, the color of which corresponds to the habitat (A) or sampling location (B) of the sequenced strains. The first two axes explain 40.6% (horizontal) and 23.4% (vertical) of variation.

