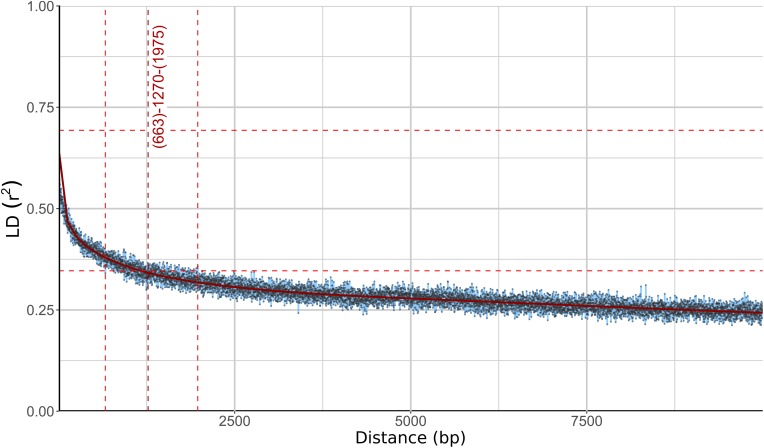
FIGURE 3.
Linkage disequilibrium (LD) decay in Wallemia ichthyophaga estimated on all biallelic loci. Squared correlation coefficient (r2) between pairs of SNP loci is plotted against the physical distance of the loci in the genome. Horizontal lines mark the maximum observed value and half of the maximum observed value. Left and right vertical lines mark the interval of the physical distance delimited by the first point of the curve under and the last point above half of the maximum r2 value. The middle vertical line marks the point where the fitted curve intersects with half of the maximum r2 value.

