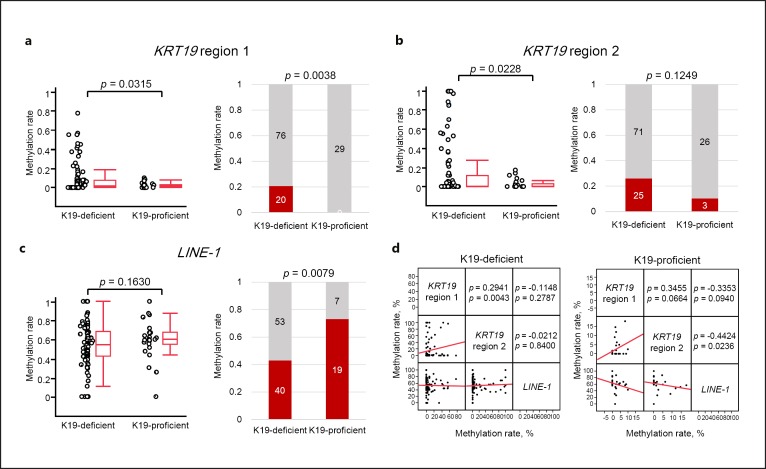
Fig. 4.
Methylation analyses of KRT19 and LINE-1 in 125 HCCs. a Results of methylation analysis in KRT19 region 1. Average methylation level (left panel) and methylation frequency (right panel) of KRT19 region 1 in HCCs with or without K19 proficiency. b Results of methylation analysis in KRT19 region 2. Average methylation level (left panel) and methylation frequency (right panel) of KRT19 region 2 in HCCs with or without K19 proficiency. c Results of methylation analysis in LINE-1. Average methylation level (left panel) and methylation frequency (right panel) of LINE-1 in HCCs with or without K19 proficiency. Left panel: in the box plot diagrams, the horizontal line within each box represents the median; the limits of each box are the interquartile ranges, and the whiskers are the maximum and minimum values. The p values were based on Kruskal-Wallis one-way analysis of variance on ranks and represent the statistical differences in average methylation between K19-deficient and proficient HCCs. Right panel: the numbers in each box denote the number of cases. The p values were based on Fisher's exact test. d Scatterplot matrix demonstrating the pairwise Spearman's correlation coefficient (ρ) between three analyzed loci in the cohort of 125 HCCs. The y and x axes denote methylation rates.

