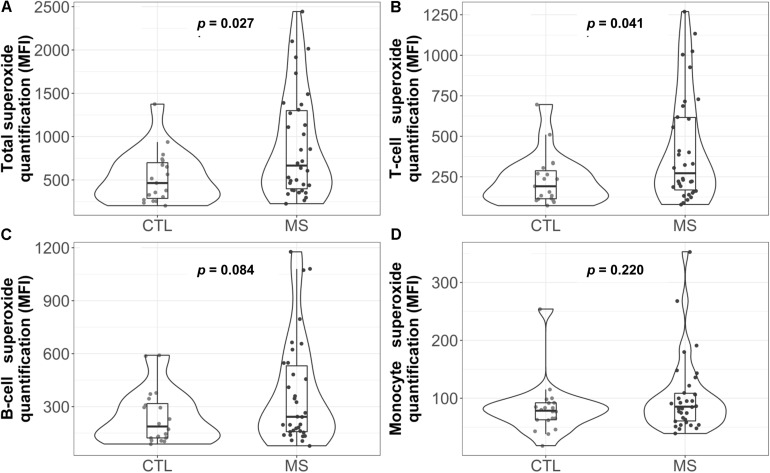
FIGURE 1.
Violin plot and boxplot of superoxide quantification in different white blood cell populations: (A) total, (B) T cells, (C) B cells, and (D) monocytes. Dots represent individual data. P-values correspond to the Mann-Whitney U test. CTL, control group; MS, multiple sclerosis group; MFI=median fluorescence intensity.

