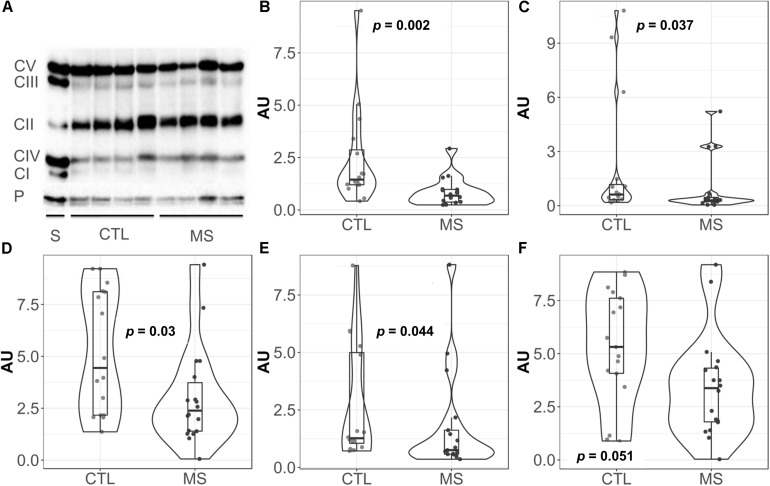
FIGURE 2.
Violin plots and boxplots of data expressed in arbitrary units (AU) corrected for porin. (A) Representative western bolt analyses of equal amounts of protein. (B) NADH dehydrogenase or complex I. (C) Succinate dehydrogenase or complex II. (D) coenzyme Q: cytochrome c – oxidoreductase or complex III. (E) Cytochrome c oxidase or complex IV. (F) ATP synthase or complex V. (F) Dots represent individual data. CTL, controls; MS, multiple sclerosis; CI, complex I; CII, complex II; CIII, complex III; CIV, complex IV; CV, complex V; P, porin; S, commercial standard of human heart tissue that indicates the location of the complexes to study.

