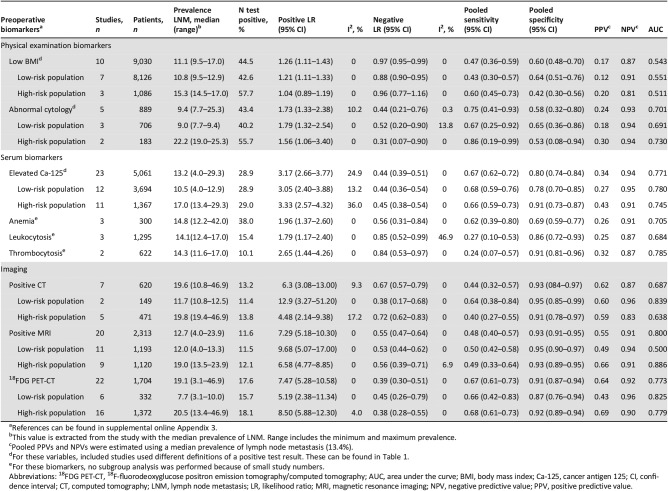
Table 2. Pooled diagnostic test characteristics of preoperative biomarkers for the prediction of LNM.
References can be found in supplemental online Appendix 3.
This value is extracted from the study with the median prevalence of LNM. Range includes the minimum and maximum prevalence.
Pooled PPVs and NPVs were estimated using a median prevalence of lymph node metastasis (13.4%).
For these variables, included studies used different definitions of a positive test result. These can be found in Table 1.
For these biomarkers, no subgroup analysis was performed because of small study numbers.
Abbreviations: 18FDG PET‐CT, 18F‐fluorodeoxyglucose positron emission tomography/computed tomography; AUC, area under the curve; BMI, body mass index; Ca‐125, cancer antigen 125; CI, confidence interval; CT, computed tomography; LNM, lymph node metastasis; LR, likelihood ratio; MRI, magnetic resonance imaging; NPV, negative predictive value; PPV, positive predictive value.

