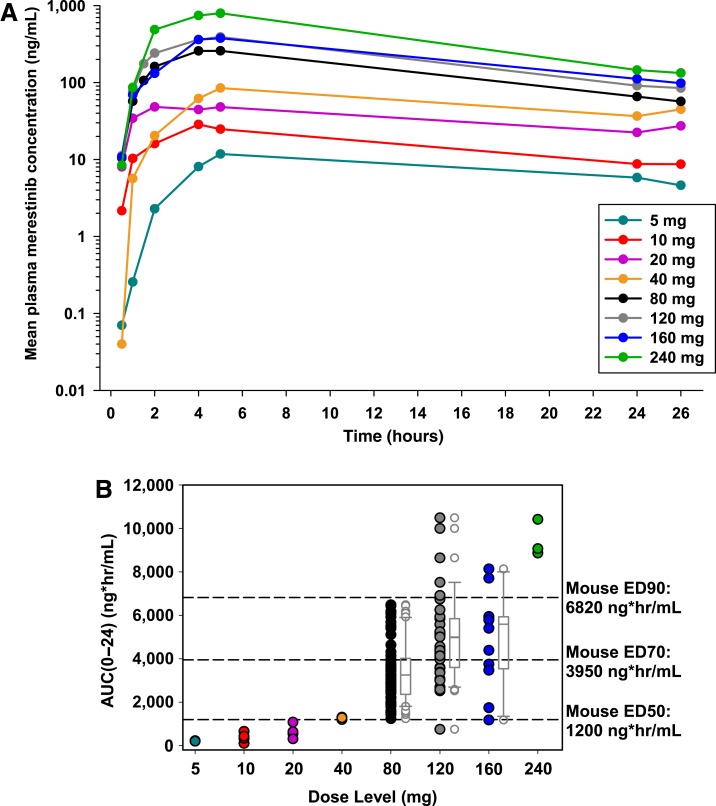
Figure 4.
Pharmacokinetics of merestinib. (A): Pharmacokinetics following the first dose of merestinib on day 1 of cycle 1 in patients receiving enabled formulation. (B): Exposure to merestinib following first dose, AUC0–24. Note: Dose levels on the x‐axis are categorical, not continuous. The axis is not drawn to scale.
Abbreviation: AUC0–24, area under the concentration‐time curve over 24 hours.

