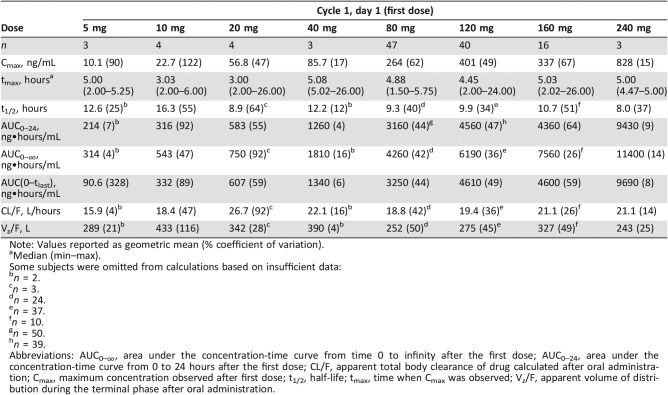
Table 4. Merestinib noncompartmental pharmacokinetic parameters for cycle 1, day 1 by dose.
Note: Values reported as geometric mean (% coefficient of variation).
Median (min–max).
Some subjects were omitted from calculations based on insufficient data:
n = 2.
n = 3.
n = 24.
n = 37.
n = 10.
n = 50.
n = 39.
Abbreviations: AUC0–∞, area under the concentration‐time curve from time 0 to infinity after the first dose; AUC0–24, area under the concentration‐time curve from 0 to 24 hours after the first dose; CL/F, apparent total body clearance of drug calculated after oral administration; Cmax, maximum concentration observed after first dose; t1/2, half‐life; tmax, time when Cmax was observed; Vz/F, apparent volume of distribution during the terminal phase after oral administration.

