
Figure 2. Predicted probabilities of diabetes (SABE-Bogotá).
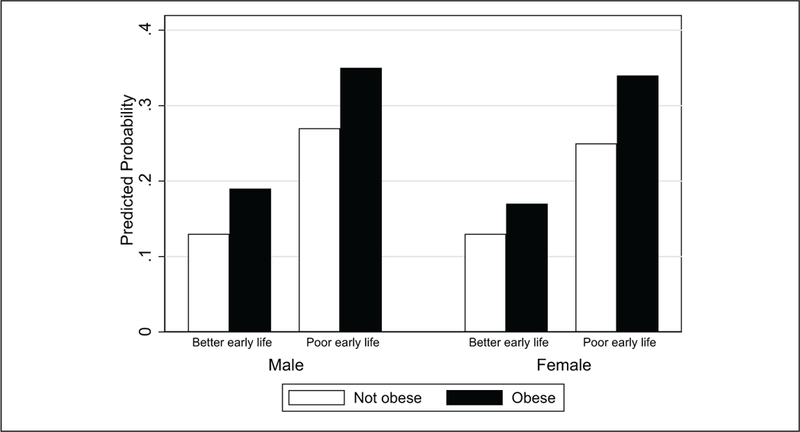
Source. Predicted probabilities derived from Table 2, Model 2 using the average response on variables and varying poor early life conditions and obesity by gender.
Note. Numbers are (from left to right bars above by gender): (A) No poor early life conditions, not obese: 0.13, 0.13 (males, females). (B) No poor early life conditions, obese: 0.19, 0.17 (males, females). (C) Poor early life conditions, not obese: 0.27, 0.25 (males, females). (D) Poor early life conditions, obese: 0.35, 0.34 (males, females). SABE = Survey of Health, Wellbeing and Aging.