Figure 3.

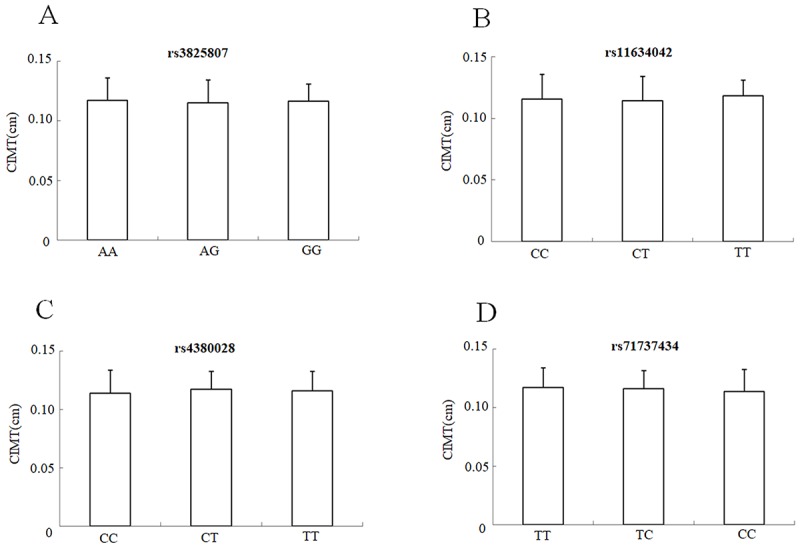
CIMT mean values ± SD of IS patients (n = 264) stratified according to the genotypes and alleles of rs3825807. (A), rs11634042 (B), rs4380028 (C) and rs7173743 (D), respectively.

CIMT mean values ± SD of IS patients (n = 264) stratified according to the genotypes and alleles of rs3825807. (A), rs11634042 (B), rs4380028 (C) and rs7173743 (D), respectively.